 Written by
Big cities can be challenging places to live. But if you are trying to leave a big city it can be difficult to find a smaller city worthy of moving to. Big cities tend to get the most attention when it comes to cost of living, quality of life and availability of economic opportunity. But there are plenty of smaller cities which are just as, if not more, livable than the big cities. Below we look at data to find the most livable small cities in the country.
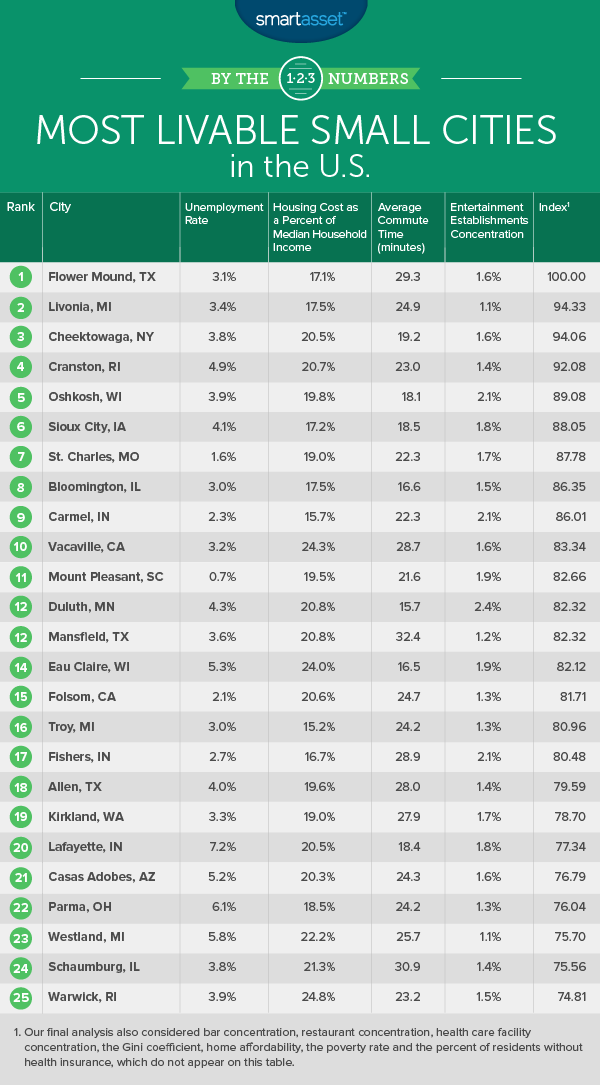
For this study, we considered small cities to be those with populations between 65,000 and 99,000. In order to rank the most livable small cities in the country, we looked at 11 metrics. We compared each city across metrics like concentration of entertainment establishments, concentration of restaurants, concentration of bars, concentration of health care establishments, income inequality, median-home-value to median income ratio, housing cost as a percent of household income, percent of residents below the poverty line, unemployment rate, percent of residents with health insurance and average commute times. Check out our data and methodology below to see where we got our data and how we put it together.
Key Findings
- Settle down in the suburbs – Even if you do not want to live right in a big city, you may want to live near one. Big cities tend to offer the best access to employment and income. Depending on your definition of suburb, it could be argued that only two cities in our top 10 are non-suburbs.
- Options nationwide – There is no single state or region that dominates this list. Most parts of the country have at least one representative in our top 25. Indiana stands out the most, with three cities in the top 20.
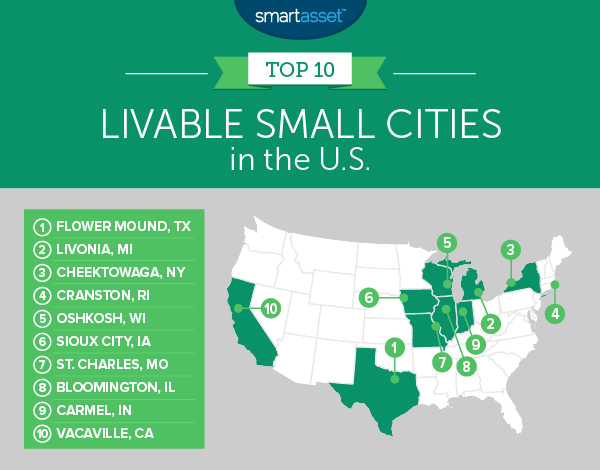
1. Flower Mound, Texas
Flower Mound tops our list due to its positive economic climate. This Dallas suburb has an unemployment rate of only 3.1% and only 4.7% of residents here find themselves under the poverty line.
Homes are also affordable relative to the average income for a household in Flower Mound. The average home in Flower Mound is worth 2.62 times the median household income, a top 30 score.
2. Livonia, Michigan
Livonia has some of the most affordable housing relative to income in this study. The average household would need to spend 17.5% of their income to afford the average home here. The average home is also worth 2.45 times the average household’s annual income. Livonia ranks in the top 20 in both of those metrics.
With all that affordable housing, Livonia residents money to sock away in their savings account or their retirement fund. Livonia also beats 80% of cities when it comes to the concentration of bars and restaurants, so residents have options for their free nights.
3. Cheektowaga, New York
Cheektowaga, a suburb of Buffalo, takes third. If you are a fan of having a drink and relaxing at a bar, Cheektowaga might be a good city for you. This city has a bar concentration of 0.9%, a score which beats 85% cities.
This would also be a great place to find an affordable home. According to our data, the average home is worth 2.23 times the average Cheektowaga household’s income. That is a top 10 score. Another plus to living and working here are the short commute times. The average commute is only 19.2 minutes.
4. Cranston, Rhode Island
Cranston is the third-largest city in the nation’s smallest state. It is located outside of Providence to the southwest. Most residents in this city face a pretty positive economic outlook. The vast majority of them – 97.6% – have health insurance, and only 6% are under the poverty line. The unemployment rate of 4.9% is slightly high however, especially by the standards of the top 10.
This city also plenty of bars and restaurants giving residents something to do in their free time. Cranston has the third-highest concentration of bars in our top 10 and the second-highest concentration of restaurants.
5. Oshkosh, Wisconsin
If you are looking for some fun, Oshkosh seems to be the place to be, at least according to Census Bureau data. Around 2.1% of all establishments in the area are dedicated to arts, entertainment or recreation, a top 25 score, and this city has the largest concentration of bars in our study.
This city does fall down the rankings slightly due to some troubling economic indicators. The area seems to have plenty of jobs but a large portion of residents still don’t earn enough. Only 3.9% of residents are unemployed but over 21% of residents are below the poverty line.
6. Sioux City, Iowa
The standard advice is to spend no more than 30% of your income on housing. Sometimes, especially if you live in a big city, staying below that number is difficult. But if you live in Sioux City, Iowa, hitting that number or even lower should be easier.
The average household here would need to spend 17% of their income to afford the average home. At the same time, the average home is worth 2.35 times the average household’s annual income. Sioux City ranks in the top 15 in both of those metrics.
7. St. Charles, Missouri
The economy across the country has started to improve but that doesn’t mean you should take finding a job for granted. Few cities in the country have as many jobs as St. Charles which makes it one of the most livable small cities in the country. According to our data, only 1.6% of residents here are unable to find a job.
Households here typically are not housing cost-burdened either. The average household would need to spend 19% of their income to afford the average home. St Charles ranks 25th in that metric.
8. Bloomington, Illinois
How does a short commute, a stable job and affordable housing sound? Bloomington combines each of these metrics to make for a very livable small city. Bloomington has an unemployment rate of only 3% and the average worker only needs 16.6 minutes to get to work. Less time getting to and from work means more free time.
When it comes to things to do Bloomington has options. It beats 90% of cities when it comes to concentration of bars and 66% of cities in concentration of restaurants.
9. Carmel, Indiana
There is plenty of high-paying work available to residents of Carmel, Indiana, and homes are relatively affordable. This city ranks in the top 10 for housing cost as a percent of household income, unemployment rate, health insurance rate and poverty rate.
In concentration of both restaurants and bars this city has below-average scores, however. On the other hand, 2.1% of all establishments are arts, entertainment or recreation focused, so there should be things to do, even if it doesn’t involve grabbing a bite to eat.
10. Vacaville, California
Vacaville rounds out our top 10 and is the only California city on the list. California is known for its high cost of living and Vacaville does not seem to be an exception.
This city has below-average scores for both of our housing affordability metrics. On the other hand, it has plenty of economic opportunity, and plenty to do for residents with a little extra income. Vacaville has the 22nd-lowest unemployment rate in our study and the eighth-highest concentration of restaurants.
Data and Methodology
In order to rank these most livable small cities in the U.S., we looked at data for 248 cities with populations between 65,000 and 99,000. Specifically, we looked at data for the following 11 metrics:
- Concentration of entertainment establishments. This is the percent of arts, entertainment and recreation establishments as a percent of all establishments. Data comes from the U.S. Census Bureau’s 2015 County Business Patterns Survey.
- Concentration of bars. This is the number of bars as a percent of all establishments. Data comes from the U.S. Census Bureau’s 2015 County Business Patterns Survey.
- Concentration of restaurants. This is the number of restaurants as a percent of all establishments. Data comes from the U.S. Census Bureau’s 2015 County Business Patterns Survey.
- Concentration of healthcare establishments. This is the number of healthcare and social assistance establishments as a percent of all establishments. Data comes from the U.S. Census Bureau’s 2015 County Business Patterns Survey.
- Gini coefficient. This is a measure of income inequality. Data comes from the U.S. Census Bureau’s 2016 1-Year American Community Survey.
- Home affordability. This is the median home value divided by median household income. Data comes from the U.S. Census Bureau’s 2016 1-Year American Community Survey.
- Housing cost as a percent of median household income. This is an affordability metric that shows how much the average household would spend on housing as a percent of their income, if they bought the average home. Data comes from the U.S. Census Bureau’s 2016 1-Year American Community Survey.
- Percent of residents below poverty line. Data comes from the U.S. Census Bureau’s 2016 1-Year American Community Survey.
- Unemployment rate. Data comes from the U.S. Census Bureau’s 2016 1-Year American Community Survey.
- Percent of residents without health insurance. Data comes from the U.S. Census Bureau’s 2016 1-Year American Community Survey.
- Average commute time. Data comes from the U.S. Census Bureau’s 2016 1-Year American Community Survey.
First, we ranked each city in each metric. Then we found each city’s average ranking. We used this average ranking to create our final score. The city with the best average ranking received a 100. The city with the worst average ranking received a 0.
Tips for Buying a Home You Can Afford
Before you start saving up for a home, it is a good idea to have a target value in mind. This will inform how much you need to save up for a down payment. Generally speaking the larger your down payment, the more home you can afford. But that also means waiting longer to buy a home. Ideally you will want to be able to pay at least 20% of the home value as a down payment. Our home affordability calculator can help you determine how much you can afford at your income level.
The other part of the equation (other than home value) that determines how much your mortgage payments will be each month, is the mortgage rate. The lower your mortgage rate the lower your payments will be. To get the lowest interest rates you will need a good credit score. If your credit score is not the best, you could increase the size of your down payment and try to negotiate with your lender. Another option is to work on raising your credit score before you even buy a home.
Finally, the length of your mortgage in important. Most people get a 30-year mortgage which means you will own your home after 30 years, but another popular option is the 15-year mortgage. The benefit of a 30-year mortgage is a lower monthly payment. But getting a 30-year mortgage also means paying more overall over the course of the loan compared to a 15-year mortgage. With a 15-year mortgage you will own your home sooner and pay less overall, but will face higher monthly payments.
Questions about our study? Contact us at press@smartasset.com.
Photo credit: ©iStock.com/ghornephoto