 Written by
It’s difficult to pursue your passions and manage your various commitments given the time that they require, especially if they are not directly linked to your job. In an ideal world, though, you earn enough to sock away sufficient savings to enjoy your leisure activities without logging excessive hours at the office or on a punishing commute. Not all cities allow professionals to strike a happy medium, so SmartAsset decided to take a look at the cities with the best work-life balance.
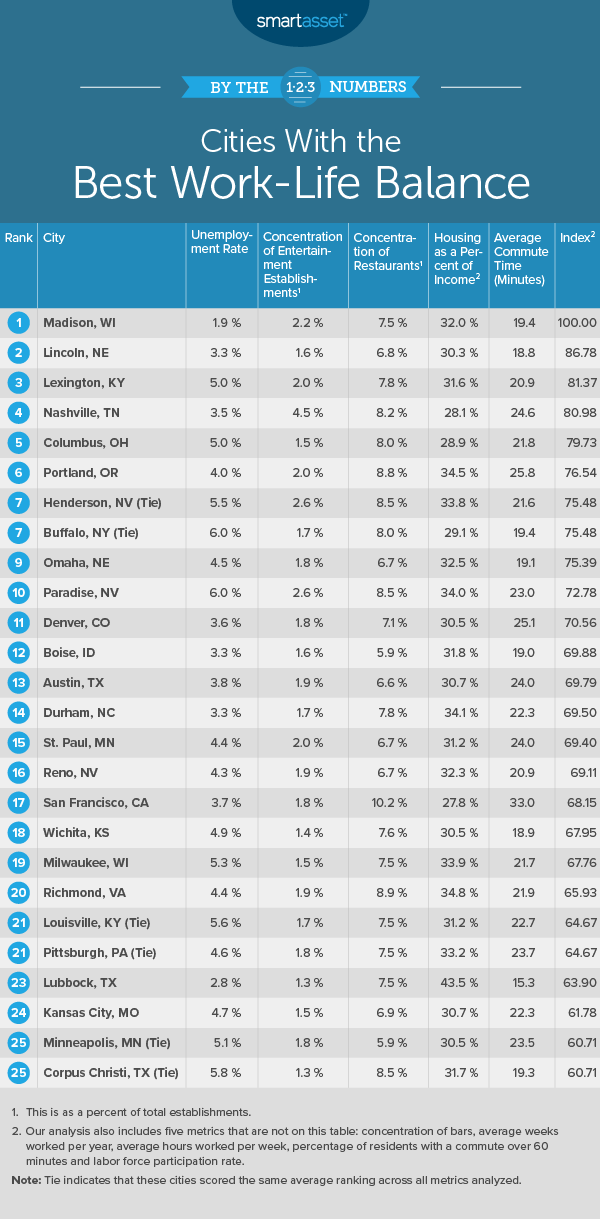
To find the cities with the best work-life balance, we compared data for the 100 largest cities across the following 10 metrics: entertainment establishment density, dining establishment density, bar density, housing costs as a percentage of income, average number of weeks worked per year, average number of hours worked per week, average commute time, percentage of workers with commutes over an hour, unemployment rate and labor force participation rate. For details on our data sources and how we put all the information together to create our final rankings, check out the Data and Methodology section below.
This is SmartAsset’s third study on the cities with the best work-life balance. Read the 2019 version here.
Key Findings
- Consistency in the top 10. Five cities in this year’s study were in the top 10 in both our study from last year as well as the year before: Madison, Wisconsin; Lincoln, Nebraska; Lexington, Kentucky; Columbus, Ohio and Omaha, Nebraska.
- Little Northeast representation in top 25. According to the data that we considered, the Northeast is not the ideal region to settle down in if you prioritize work-life balance. Buffalo, New York and Pittsburgh, Pennsylvania, ranking sixth and 22nd overall, respectively, are the only two Northeastern cities to crack our top 25.
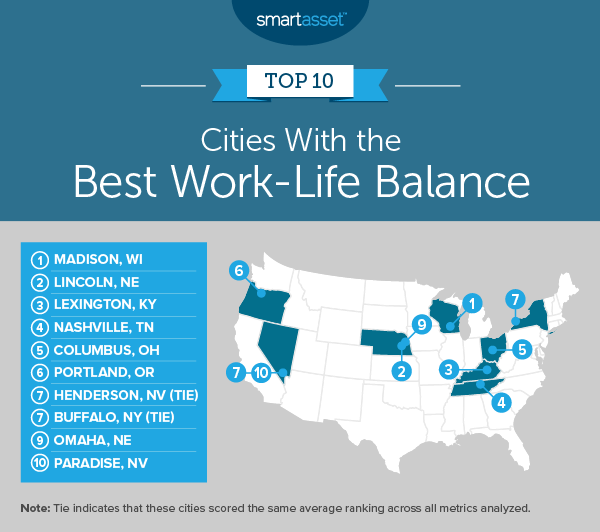
1. Madison, WI
Madison, Wisconsin takes the top spot in our study on the best cities for work-life balance. It ranks in the top 10% of the study for six out of the 10 metrics we considered. It does the best across all 100 cities overall for both its low unemployment rate, at 1.9%, and its low percentage of workers with a commute longer than 60 minutes, at 2.3%. Workers there have an average commute time of less than 20 minutes and work less than 37 hours per week on average. With all the time they’re saving, they’ll be able to enjoy other meaningful activities such as checking out art galleries or spending time with friends. Arts, entertainment and recreation establishments in Madison comprise about 2.2% of all establishments and bars comprise more than 1% of all establishments, both top-10 rates.
2. Lincoln, NE
Lincoln, Nebraska is the second-best city for work-life balance in our study of the largest 100 cities. It has top-10 rates for three of the 10 metrics we considered and top-15 rates for two additional metrics. Lincoln does particularly well for its low average commute time, at 18.8 minutes, which is the lowest average commute time in the top 10 and ranks third in the study overall. Its relatively low unemployment rate of 3.3% ranks fourth-lowest overall, and its labor force participation rate is 72.3%, ranking seventh-highest overall.
3. Lexington, KY
Lexington, Kentucky ranks in the top 15% of the study for three of the 10 metrics we considered: arts, entertainment and recreation establishments as a percentage of all establishments, at 2%; average hours worked per week at 37.7 and average commute time at less than 21 minutes.
4. Nashville, TN
Nashville, Tennessee performs particularly well for its relatively high percentage of arts, entertainment and recreation establishments as a percentage of all establishments, at 4.5%, the highest rate for this metric in the top 10 and the fourth-highest rate for this metric across all 100 cities in the study. Nashville also ranks best in the top 10 for its relatively low rate of housing costs as a percentage of income, at 28.1%, which is the sixth-lowest rate for this metric overall.
5. Columbus, OH
Columbus, Ohio ranks in the top 25% of all 100 cities for five out of the 10 metrics we considered. Housing costs as a percentage of income in Columbus are about 29%, the ninth-lowest in the study overall, and the percentage of workers with a commute longer than one hour is 3.1%, the 14th-lowest in the study overall. With the extra time and money that they save, Columbus residents might choose to eat out at one of the city’s restaurants, which comprise more than 8% of its total establishments.
6. Portland, OR
Portland, Oregon does particularly well for its high number of bars as a percentage of all establishments, at 1.22%, the highest rate for this metric in the top 10 and fifth-highest overall. Furthermore, Portland ranks in the top fifth of the study for its high concentration of arts and recreation establishments, at 1.98%; its high concentration of restaurants, at 8.82% and its high labor force participation rate, at 70.7%.
7. Henderson, NV (tie)
Henderson, Nevada, ranking within the top half of the study for seven out of the 10 metrics we considered, ties with Buffalo, New York for the No. 7 spot in our study. Henderson ranks particularly well for its high percentage of arts, entertainment and recreation establishments, at 2.6% of all establishments and tying for the fifth-highest rate overall in that metric. Furthermore, it ranks well for its low percentage of workers with a commute longer than one hour, at only 2.4% and the third-lowest rate for this metric overall. Henderson also ranks No. 1 in our study of cities where retirees are moving.
7. Buffalo, NY (tie)
Buffalo, New York is tied with Henderson, Nevada for the seventh-best city for work-life balance in our study. It ranks in the top 10% of the study for four metrics. Housing costs as a percentage of income in Buffalo are 29.1%, ranking 10th-lowest in the study. Average commute time for workers there is 19.4 minutes, the eighth-lowest time across all 100 cities in the study. Employees in Buffalo work an average of 31.7 weeks per year, the seventh-lowest amount in the study. And finally, Buffalo performs the best for the metric of average number of hours that employees work per week, at 36.8, the lowest rate in the study for this metric.
9. Omaha, NE
Omaha, Nebraska ranks within the top 7% of all 100 cities in the study for three metrics: high number of bars as a percentage of all establishments, low average commute time for workers and low percentage of workers with a commute longer than one hour. Approximately 1.1% of all establishments in Omaha are bars, workers commute an average of 19.1 minutes and less than 3% of workers have a commute that lasts more than 60 minutes.
10. Paradise, NV
Paradise, Nevada ranks within the top 25% of the study for four out of the 10 total metrics we considered. Like Henderson, it ranks particularly well for its high percentage of arts, entertainment and recreation establishments, at 2.6% of all establishments — a percentage that ties it for the fifth-highest rate for this metric in the whole study. In addition, its high percentage of bars, at almost 1% of all establishments, ties for the 13th-highest rate for this metric overall. The average commute time in Paradise is 23 minutes and about 3.7% of workers have a commute that is longer than one hour.
Data and Methodology
To find the best cities for work-life balance, we analyzed data for the 100 largest cities in the U.S. across the following 10 metrics:
- Concentration of arts, entertainment and recreation establishments. This is the number of arts, entertainment and recreation establishments as a percentage of all establishments. Data comes from the Census Bureau’s 2017 County Business Patterns Survey.
- Concentration of restaurants. This is the number of restaurants as a percentage of all establishments. Data comes from the Census Bureau’s 2017 County Business Patterns Survey.
- Concentration of bars. This is the number of bars as a percentage of all establishments. Data comes from the Census Bureau’s 2017 County Business Patterns Survey.
- Housing costs as a percentage of income. This is the median housing costs as a percentage of income for full-time workers. Data comes from the Census Bureau’s 2018 1-year American Community Survey.
- Average number of weeks worked per year. This is how many weeks per year local employees works. Data comes from the Census Bureau’s 2018 1-year American Community Survey.
- Average number of hours worked per week. This is the average number of hours a workers work in a week. Data comes from the Census Bureau’s 2018 1-year American Community Survey.
- Average commute time. This is the average number of minutes it takes for a worker to commute to work. Data comes from the Census Bureau’s 2018 1-year American Community Survey.
- Percentage of workers with a commute longer than 60 minutes. Data comes from the Census Bureau’s 2018 1-year American Community Survey.
- Unemployment rate. Data comes from the Census Bureau’s 2018 1-year American Community Survey.
- Labor force participation rate. Data comes from the Census Bureau’s 2018 1-year American Community Survey.
First, we ranked each city in each metric. We then found each city’s average ranking, giving a full weight to all metrics except average weeks worked per year and average hours worked per week, each of which received a half weight. We used these average rankings to create our final score. The city with the highest average ranking received a score of 100 while the city with the lowest average ranking received a score of 0.
Tips a Balanced Budget and Work-Life Balance
- Budget wisely. Even if you’re saving time on a shorter commute, make sure you’re saving enough money for the activities you enjoy doing in your downtime as well for your future retirement plans. Use our comprehensive budget tool to get a sense of what your current money matters are.
- Everything in moderation. It’s all about striking a happy medium in your professional and personal lives, and that same logic can apply to your budget as well. Try using the 50/30/20 rule to find the right stride in your money management.
- Consider balanced financial advice. Finding the right financial advisor that fits your needs doesn’t have to be hard. SmartAsset’s free tool matches you with financial advisors in your area in 5 minutes. If you’re ready to be matched with local advisors that will help you achieve your financial goals, get started now.
Questions about our study? Contact press@smartasset.com
Photo credit: ©iStock.com/sanjeri