 Written by
A healthy work-life balance is something most professionals in the U.S. highly value. In fact, 53% of employees say that a job conducive to a greater work-life balance and improved personal well-being is “very important,” according to Gallup’s State of the American Workplace 2017 report. Of course, certain places around the country are better than others at helping you achieve a happy equilibrium. Living in cities with burdensome commutes and the expectation that people work long hours puts a ton of stress on the “life” part of the work-life balance. On the other hand, some cities with high unemployment rates simply make it more difficult for people to achieve their career ambitions and boost the “work” part of the equation.
Below, we examined a total of 10 factors to rank the best cities for a good work-life balance. Specifically, we looked at entertainment establishment density, dining establishment density, bar density, housing costs as a percent of income, average weeks worked per year, average hours worked per week, average commute time, percent of commutes that are at least an hour, unemployment rate and labor force participation rate. Check out our data and methodology below to see where we got our data and how we put it together to create our rankings.
This is the 2019 version of this study. Check out the 2018 version here.
Key Findings
- Same trio at the top – Once again Madison, Wisconsin; Lincoln, Nebraska; and Omaha, Nebraska finish first, second and third, respectively.
- California and Florida are the worst states for balance – In the bottom-15 cities with the worst work-life balance, we find nine cities from either the Golden State or the Sunshine State.
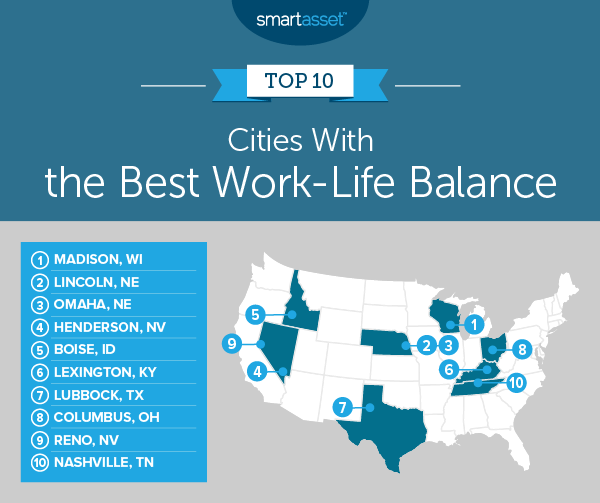
1. Madison, Wisconsin
Of the largest cities in the country, Madison appears to promote the best work-life balance for its residents. According to our data, this city has plenty of working opportunities: It ranks second for unemployment rate, at just 2.3%. Madison also has a high labor force participation rate, at just over 85%. Time at work is also manageable for workers here: Madison ranks in the top 10 for average hours worked per week. If you are looking for fun, Madison ranks ninth, with 2.2% of all establishments falling into the entertainment category.
2. Lincoln, Nebraska
Two Nebraska cities take the second and third spots. Up first is Lincoln. Lincoln is another city where hitting your professional goals should not be out of reach. This city ranks in the top 10 for both unemployment rate and labor force participation rate. Getting to and from your job in Lincoln should not add any extra stress to your life, either. The average commute in Lincoln is 19 minutes, a figure only five other cities beat.
3. Omaha, Nebraska
Omaha has many similarities with Lincoln. Commutes here are short, housing is affordable and, for the most part, jobs are plentiful. Omaha does not quite hit the heights that Lincoln does, which is why it finds itself in third. Omaha ranks 17th and 10th for unemployment rate and labor force participation rate, respectively. If you are a fan of going out to bars and hanging with friends outside the home, you could argue Omaha is a better spot than Lincoln. Omaha ranks better than Lincoln in both entertainment establishment density and bar density.
4. Henderson, Nevada
Henderson, Nevada ranks fourth thanks to the abundance of leisure options and the excellent commute times. In each of our three leisure figures, Henderson ranks no worse than 21st. Henderson stands out for its high density of entertainment establishments (2.4% of all establishments are in the entertainment category). In that metric, it ranks fifth overall.
5. Boise, Idaho
Idaho’s capital comes in fifth and is one of the cities with the smoothest average commutes. Only 3% of commuters here spend at least 60 minutes getting to work, the best rate in the country. However, the average commute here is about two and a half minutes longer than Lubbock’s. Boise also ranks in the top 30 for unemployment rate and labor force participation rate. The only criticism one might have for Boise is that it may offer residents less excitement. This city ranks about average in entertainment establishment density and 93rd in dining establishment density.
6. Lexington, Kentucky
Sometimes people work extra-long hours, because they need to cover all their monthly expenses. Census Bureau estimates from Lexington suggest that, on average, most people should be able to handle their housing expenses and have plenty left over each month to save. According to our analysis, housing costs equal just 26% of income for the median full-time worker.
7. Lubbock, Texas
Another city where it is hard to get upset about the morning commute is Lubbock, Texas. The average commute here is just 16 minutes, and only 2.5% of workers have a commute that is at least an hour. That means even if you have to work slightly longer hours in Lubbock, you still have time to enjoy your personal life thanks to short commute times.
8. Columbus, Ohio
Columbus has a little bit of everything when it comes to building a healthy work-life balance. In total, Columbus ranks above average in eight of the 10 metrics we analyzed, only falling short in the density of entertainment establishments and average weeks worked per year. For the most part, commutes here are manageable, and Columbus has a high density of eateries and bars.
9. Reno, Nevada
Reno’s best scores came in the commuting and entertainment metrics. In entertainment establishment density, Reno ranked 10th, with 2% of establishments falling into that category. The average commute in Reno is 20.4 minutes, 10th lowest in the study.
10. Nashville, Tennessee
If you are looking for things to do, you will struggle to find a city with more options than Nashville. This city ranks fourth in entertainment establishment density, with 4.4% of establishments falling into the entertainment category. This city also has strong employment figures. In both unemployment rate and labor force participation rate, it ranks in the top 15.

Data and Methodology
In order to find the cities with the best work-life balance, we looked at data on the 100 largest cities in the country. Specifically, we looked at the following 10 metrics:
- Concentration of arts, entertainment and recreation establishments. This is the number of arts, entertainment and recreation establishments as a percent of all establishments. Data comes from the Census Bureau’s 2016 County Business Patterns Survey.
- Concentration of restaurants. This is the number of restaurants as a percent of all establishments. Data comes from the Census Bureau’s 2016 County Business Patterns Survey.
- Concentration of bars. This is the number of bars as a percent of all establishments. Data comes from the Census Bureau’s 2016 County Business Patterns Survey.
- Housing as a percent of income. This is median housing cost as a percent of income for full-time workers. Data comes from the Census Bureau’s 2017 1-Year American Community Survey.
- Average weeks worked per year. This is how many weeks per year the average worker works. Data comes from the Census Bureau’s 2017 1-Year American Community Survey.
- Average hours worked per week. This is the number of hours the average worker works in a week. Data comes from the Census Bureau’s 2017 1-Year American Community Survey.
- Average commute time. This is the average number of minutes it takes for a worker to commute to work. Data comes from the Census Bureau’s 2017 1-Year American Community Survey.
- Percent of workers with a commute longer than 60 minutes. Data comes from the Census Bureau’s 2017 1-Year American Community Survey.
- Unemployment rate. Data comes from the Census Bureau’s 2017 1-Year American Community Survey.
- Labor force participation rate. Data comes from the Census Bureau’s 2017 1-Year American Community Survey.
First, we ranked each city in each metric. Then, we found each city’s average ranking, giving a half weighting to average weeks worked and average hours worked. We gave the unemployment rate a double weighting. Using this average ranking, we created our final score. The city with the best average ranking received a 100, and the city with the worst average ranking received a 0.
Tips for Settling in a Place With a Healthy Work-Life Balance
- Do your homework – Even if you can afford a home, it is probably not a good idea to rush into homeownership, even in a place known for an attractive work-life balance. Make sure you take your time and look at a number of properties before deciding what you want.
- Watch out for extras – If you are new to the homebuying process, you may not be aware that homeowners pay more than just their mortgage. Extra costs like property taxes and homeowners insurance can make what seemed like a manageable monthly housing cost into a burden. In some states, like Colorado or Hawaii, property taxes are low. In others, like Illinois, they are high.
- Ask an expert – A home is likely the largest purchase you will ever make in your life. So why not make sure you are making a smart purchase by working with a qualified financial advisor? If you are not sure where to find a financial advisor, check out SmartAsset’s financial advisor matching tool. It will match you with up to three local financial advisors who fit your financial planning needs.
Questions about our study? Contact us at press@smartasset.com
Photo credit: iStock.com/nazar_ab
This article was originally published on January 15, 2019.