 Written by
Homeownership is a hallmark of American society. Data from the Federal Reserve Bank of St. Louis shows that 64.2% of homes in America are owner-occupied, and a Pew Research survey from 2016 found that 72% of renters would like to own a home at some time in the future. But the benefits to home ownership are different based on which state you live. Some states have seen fast-growing home values while others offer affordable mortgages, thanks to low property tax rates.
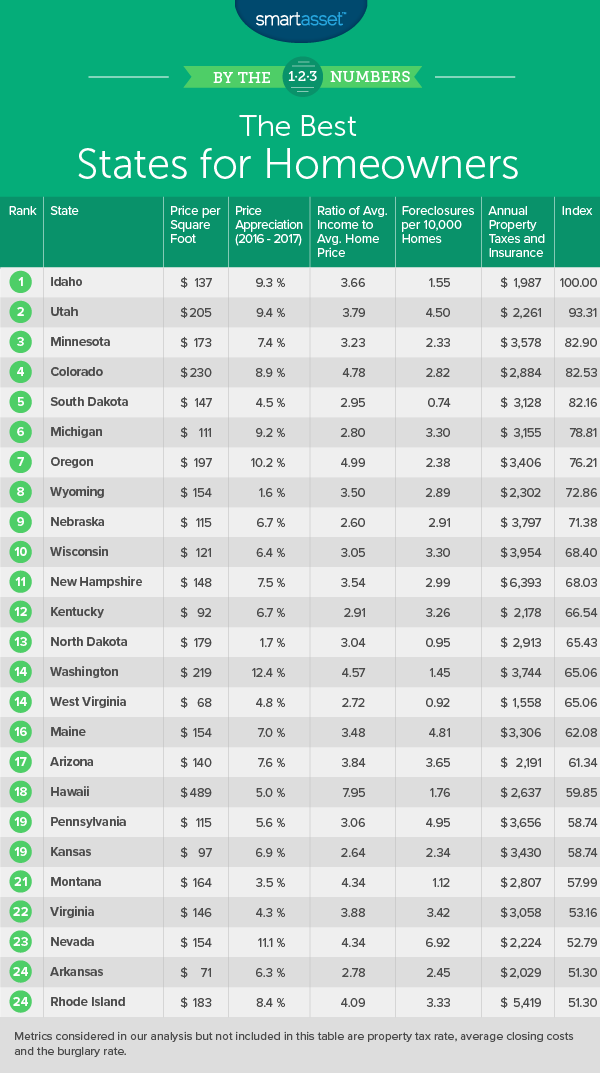
In order to find the best states for homeowners, we looked at nine metrics. Specifically we looked at average price per square foot, the one-year percent change in value per square foot, foreclosures per 10,000 homes, average effective property tax rate, median annual property taxes, average closing costs, average homeowners insurance and the burglary rate. Check out our data and methodology section below to see where we got our data and how we put it together.
Key Findings
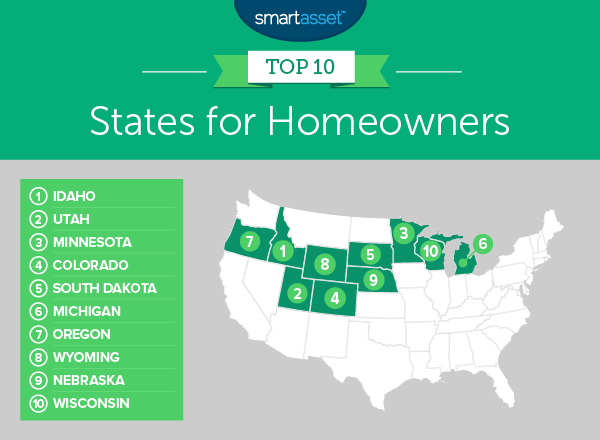
- Midwest and West on top – All the states in our top 10 are either in the West or the Midwest. Midwest states tend to be more affordable while home values are on the rise in Western states.
- Good investments – Even states which ranked poorly tended to have some home value growth. The only state which did not show any growth in home values from 2016 to 2017 was Alaska, where home values decreased by 0.4%.
1. Idaho
Idaho is a great place for homeowners looking to make a profit on their home investment. From 2016 to 2017, the value per square foot of the average home in Idaho increased by 9.3%. That is the sixth-fastest rate recorded in our study.
The state is also a fairly safe place to be a homeowner. Homeowners insurance costs are low here and Idaho has the 16th-lowest burglary rate in our study. Homeowners in it for the long-haul can rejoice as well: Idaho’s property tax rates are the 14th-lowest in our study.
2. Utah
The median home in Utah has a value of $205 per square foot. That is the sixth-most in the study. You can probably expect that number to continue rising as well. From 2016 to 2017 that figure grew by 9.4%, a top 5 rate. One cost that new homebuyers may overlook is closing costs. That isn’t too much of a concern in Utah. Average closing costs are under $1,900, the fifth-lowest in our study.
The main concern for Utah homebuyers may be the upfront affordability. The average home in Utah is worth 3.79 times the median annual income, a below-average figure.
Related Article: 529 Plans in Utah
3. Minnesota
Minnesota scores well across the board, securing the third spot. In total this state scored better than 50% of states in six of our nine metrics. Notable scores include foreclosure rate, average closing costs and burglary rate. In each of those metrics Minnesota scored in the top 15.
Homes here are also more affordable for the average homebuyer than they are in the two states ranked above. The average home in Minnesota is worth 3.23 times the median household income.
4. Colorado
Colorado homes come with a high upfront cost, but if you can manage to become a homeowner here it is likely your investment will pay off. In 2018, the average Colorado home had a value per square foot of $230. That figure rose nearly 9% from 2016 to 2017.
The one stumbling block, as mentioned, is the upfront cost. The average home here is worth nearly 4.8 times the median household income. But if you’re a Colorado homeowner with good credit, you may be able to secure a low mortgage rate. After paying off the mortgage you won’t have to worry about long-run costs. Colorado’s effective property tax rate is only 0.51%, third-lowest in our study.
5. South Dakota
South Dakota comes in fifth, primarily thanks to the lowest foreclosure rate in the study and the second-lowest average closing costs. Other important metrics include affordability. The average home here is worth less than three times the median household income, meaning most households should be able to buy a home.
6. Michigan
Another Midwest state pops up in this top 10, this time it is the Wolverine State in sixth. Michigan has affordable homes which are quickly growing in value. Census Bureau data shows that the median home in Michigan is worth only 2.8 times the median household income, and from 2016 to 2017 the value per square foot of the average home grew by 9.2%.
In each of those metrics Michigan ranks in the top 10.
Related Article: 529 Plans in Michigan
7. Oregon
Homes in Oregon are a pretty good investment. From 2016 to 2017, the value per square foot of the average home in Oregon grew by 10%. For that metric, Oregon ranks fourth. Unfortunately not every Oregonian may be able to get in on the home-buying bonanza. The median home here is worth five times the average household’s annual income. Oregon property taxes are also higher than average.
However, one cost where homeowners in Oregon save is homeowners insurance. Oregon ranks first in the study for average annual homeowners insurance cost.
8. Wyoming
The Cowboy State ranks eighth. This state is one of the safest for homeowners. According to data from the FBI, Wyoming has a burglary rate of 303 per 100,000 residents, which is the ninth-lowest in the study.
Wyoming property tax rates are also among the lowest in the nation. The average homeowner pays under $1,300 per year, which equals an effective property tax rate of 0.61%.
9. Nebraska
The Midwest domination of this list continues in Nebraska. The Cornhusker State takes a top 10 spot thanks to its affordability. The median home is worth only 2.6 times the median household income in Nebraska, meaning the dream of homeownership should be open to most residents. Closing costs are also low and Nebraska is a safe state for homeowners. In both average closing costs and burglary rate Nebraska ranks in the top 15.
The long-term costs of owning a home are slightly on the high side, however. Nebraska property taxes are some of the highest in the top 10.
10. Wisconsin
Wrapping up the top 10 is Wisconsin. This state scored in the top 10 in three different metrics, including average closing costs, average annual homeowners insurance costs and burglary rate.
Wisconsin also posted above-average scores in affordability and foreclosures. Census Bureau data shows that the median home in Wisconsin is worth just 3.05 times more than the median household income.
Data and Methodology
In order to rank the best states for homeowners, SmartAsset analyzed data for all states except Vermont due to a lack of data for that state. We used the following metrics to rank the states:
- Average price per square foot. Data comes from Zillow and is for March 2018.
- Home value appreciation. This is the percent change in value per square foot from 2016 to 2017. Data comes from Zillow.
- Median-home-value-to-median-household-income ratio. This is the median value of a home divided by the median household income. Data comes from the Census Bureau’s 2016 1-year American Community Survey.
- Foreclosures per 10,000 homes. Data comes from RealtyTrac.
- Effective property tax rate. This is the median home value divided by median annual property taxes. Data comes from the Census Bureau’s 2016 1-Year American Community Survey.
- Median annual property taxes. Further, we looked at the average amount residents in each state pay in property taxes. This data comes from the U.S. Census Bureau’s 2015 ACS one year estimate.
- Average closing costs. These numbers offer a look at the average amount residents in each state pay in closing costs. This data comes from Bankrate.
- Average annual homeowners insurance. Another cost homeowners must consider is homeowners insurance. The numbers reflect ValuePenguin data from 2013.
- Burglary rate. This is the number of burglaries per 100,000 residents. Data comes from the FBI and is for 2016
To create our final rankings, we first ranked each state in each metric. Then we found each state’s average ranking, giving a full weight to all metrics except effective property tax rate, median annual property taxes, average annual closing costs and annual cost of homeowners insurance which all received a half weight. Using this average ranking we created our final score. The state with the best average ranking received a 100 and the state with the worst average ranking received a 0.
Tips for Finding an Affordable Home
- Save early – As our data above shows the average home in some states can be worth quite a few years’ worth of income. It’s a good idea to start saving as early as possible in order to have a down payment ready once you find your dream home. You don’t want to be in a position where you find a home you love but can’t yet afford the down payment because you started saving too late.
- Extras can hurt – Another factor we highlighted in the above study are the costs of buying and owning a home that people tend to overlook. Closing costs, property taxes and homeowners insurance all fall into that bucket. If you are wondering how much all that combined can cost, look to states like New Jersey or New Hampshire. The average homeowner in New Jersey pays over $9,000 per year thanks to New Jersey property taxes and homeowners insurance. On average New Hampshire property taxes add on an additional $5,500 to local homeownership costs.
- Enlist an expert – Homeownership may not be right for every person in every situation. In order to have a firm understanding of how buying a home affects your finances you may want to speak with a financial advisor. SmartAsset’s financial advisor matching tool can match you with an advisor in your area who will make sure you are on track to hit all of your financial goals. First you’ll answer a short series of questions about your finances and then you’ll be matched with up to three advisors in your area for free.
Questions about our study? Contact us at press@smartasset.com.
Photo credit: ©iStock.com/Ridofranz