 Written by
Deciding where the best place is for you to live involves balancing a number of factors, including the ease of your commute. Not only does getting to and from work take up a lot of time, but it can also heavily affect your budget. Proximity to the city center, where many people work, is often a major consideration. Sometimes you’ll want to live extremely close to the downtown area so that you don’t have a long commute. Other times, though, it will make sense to commute a farther distance and live in a more affordable suburban or exurban area where it is possible to save more money to pay off your mortgage. You’ll need to compare things like cost of living, commuting cost and the difficulty of the commute. That’s why SmartAsset has assembled a list of the best places in America for those who want to live outside the city proper and commute in for work.
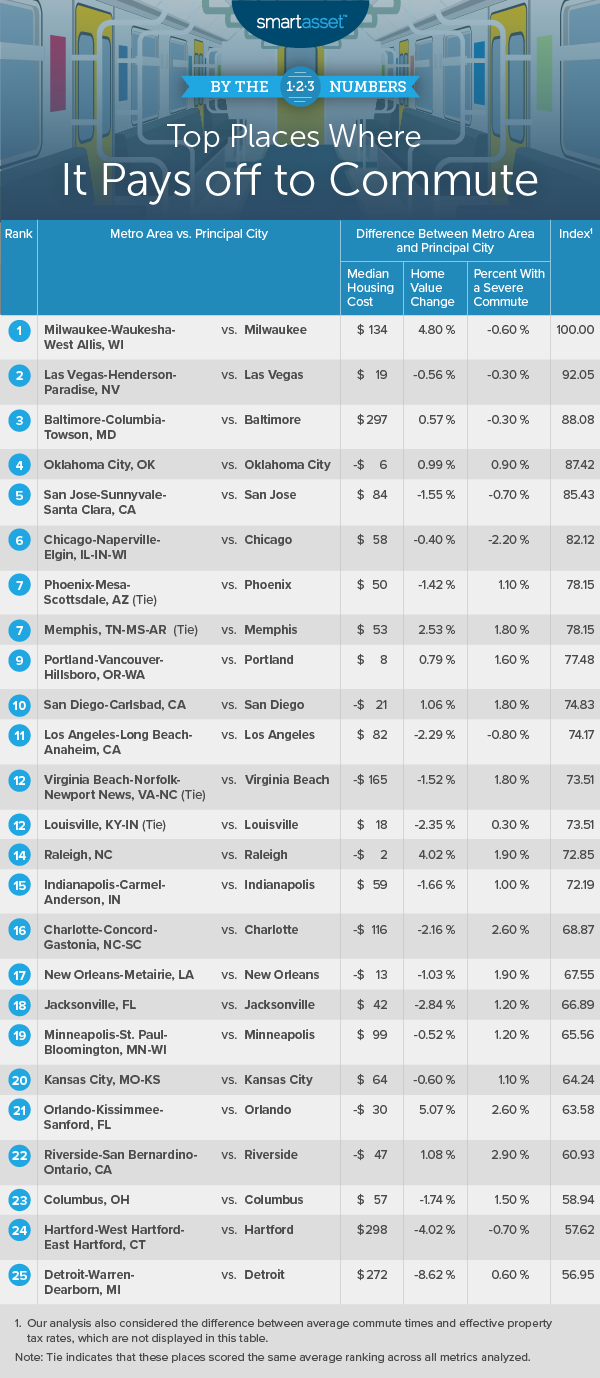
To find the best places in America where it pays off to commute, we compared metro areas to their main cities across five different factors: differences in housing costs, commute times, property taxes, home value change and the odds of a long commute. The Data and Methodology section below shows how we gathered our data and analyzed it.
This is SmartAsset’s second study on places where it pays off to commute. Read our 2018 study here.
Key Findings:
- West is best. The Western region of the country has a lot of representation in the top 10 this year. There are four metro areas in the Pacific time zone in the top 10.
- Consistent commuters. The Charlotte-Concord-Gastonia, North Carolina-South Carolina metro area dropped 15 places from the No. 1 spot in 2018. Overall, however, top-10 trends continue: More than half of the places on this year’s list were also in the top 10 last year.
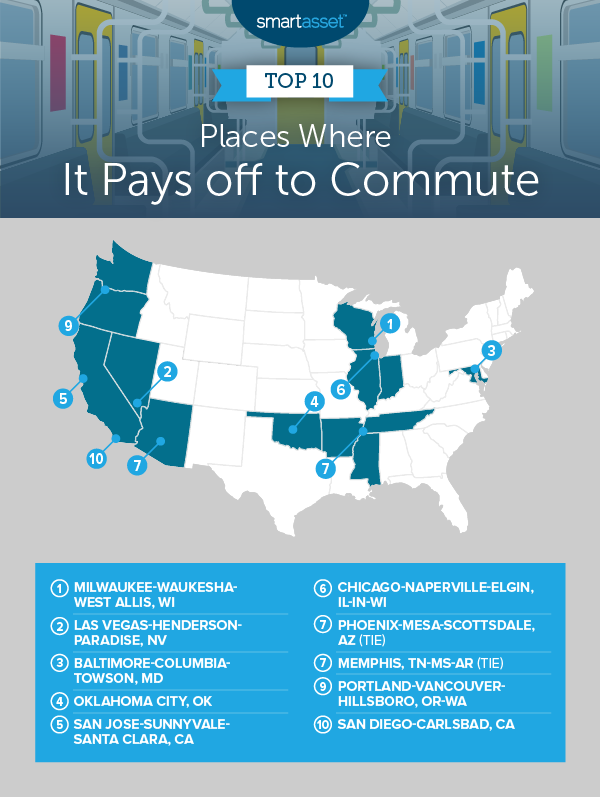
1. Milwaukee-Waukesha-West Allis, WI
| Median Housing Cost | Home Value Change | Average Commute Time (minutes) | Percentage With a Severe Commute | Effective Property Tax Rate | |
| Milwaukee | $860 | 6.63% | 22.2 | 4.80% | 2.60% |
| Milwaukee-Waukesha-West Allis, WI | $994 | 4.80% | 23.2 | 4.20% | 1.81% |
2. Las Vegas-Henderson-Paradise, NV
| Median Housing Cost | Home Value Change | Average Commute Time (minutes) | Percentage With a Severe Commute | Effective Property Tax Rate | |
| Las Vegas | $1,098 | 7.53% | 25.2 | 4.20% | 0.63% |
| Las Vegas-Henderson-Paradise, NV | $1,117 | 6.97% | 24.5 | 3.90% | 0.61% |
3. Baltimore-Columbia-Towson, MD
| Median Housing Cost | Home Value Change | Average Commute Time (minutes) | Percentage With a Severe Commute | Effective Property Tax Rate | |
| Baltimore | $1,070 | 0.59% | 31.6 | 13.40% | 1.74% |
| Baltimore-Columbia-Towson, MD | $1,367 | 1.16% | 31.5 | 13.10% | 1.07% |
4. Oklahoma City, OK
| Median Housing Cost | Home Value Change | Average Commute Time (minutes) | Percentage With a Severe Commute | Effective Property Tax Rate | |
| Oklahoma City | $960 | 0.70% | 21.4 | 2.90% | 1.13% |
| Oklahoma City, OK | $900 | 1.69% | 23.0 | 3.80% | 1.05% |
5. San Jose-Sunnyvale-Santa Clara, CA
| Median Housing Cost | Home Value Change | Average Commute Time (minutes) | Percentage With a Severe Commute | Effective Property Tax Rate | |
| San Jose | $2,257 | 6.57% | 31.3 | 12.50% | 0.78% |
| San Jose-Sunnyvale-Santa Clara, CA | $2,341 | 5.02% | 30.0 | 11.80% | 0.73% |
6. Chicago-Naperville-Elgin, IL-IN-WI
| Median Housing Cost | Home Value Change | Average Commute Time (minutes) | Percentage With a Severe Commute | Effective Property Tax Rate | |
| Chicago | $1,185 | 4.92% | 34.9 | 16.30% | 1.52% |
| Chicago-Naperville-Elgin, IL-IN-WI | $1,243 | 4.52% | 31.8 | 14.10% | 2.19% |
7. Phoenix-Mesa-Scottsdale, AZ (tie)
| Median Housing Cost | Home Value Change | Average Commute Time (minutes) | Percentage With a Severe Commute | Effective Property Tax Rate | |
| Phoenix | $1,060 | 8.30% | 26.3 | 6.20% | 0.60% |
| Phoenix-Mesa-Scottsdale, AZ | $1,110 | 6.88% | 26.8 | 7.30% | 0.60% |
7. Memphis, TN-MS-AR (tie)
| Median Housing Cost | Home Value Change | Average Commute Time (minutes) | Percentage With a Severe Commute | Effective Property Tax Rate | |
| Memphis | $861 | 1.96% | 21.5 | 2.00% | 1.68% |
| Memphis, TN-MS-AR | $914 | 4.49% | 24.2 | 3.80% | 1.08% |
9. Portland-Vancouver-Hillsboro, OR-WA
| Median Housing Cost | Home Value Change | Average Commute Time (minutes) | Percentage With a Severe Commute | Effective Property Tax Rate | |
| Portland | $1,374 | 8.20% | 27.0 | 6.90% | 0.93% |
| Portland-Vancouver-Hillsboro, OR-WA | $1,182 | 8.99% | 27.7 | 8.50% | 0.96% |
10. San Diego-Carlsbad, CA
| Median Housing Cost | Home Value Change | Average Commute Time (minutes) | Percentage With a Severe Commute | Effective Property Tax Rate | |
| San Diego | $1,756 | 5.80% | 24.7 | 5.30% | 0.68% |
| San Diego-Carlsbad, CA | $1,735 | 6.86% | 26.3 | 7.10% | 0.71% |
Data and Methodology
To find the most affordable metro areas for commuters, we compared data for 50 of the largest metro areas and their principal cities across the following five metrics:
- Housing cost. This shows the difference in median housing cost for residents living in the metro area compared to those living in the principal city of the metro area.
- Average commute times. This metric shows the difference in the time it takes to travel to work, on average, for residents living in the metro area compared to those living in the principal city.
- Property tax rate. The difference between the average effective property tax rates for the metro area compared to the principal city.
- Home value change. This metric shows the difference between the percentage change in home values from 2016 to 2017 in the metro area compared to the principal city.
- Severe commute times. This shows the difference between the percentage of residents living in the metro area who spend more than 60 minutes travelling to work compared to residents living in the principal city.
All data comes from the Census Bureau’s 2017 1-year American Community Survey.
We ranked all metro areas in each metric. Next, we found the average ranking for each metro area, weighting all metrics equally. Using this average, we created the final rankings. The metro area with the best average ranking got an index score of 100, while the metro area with the worst average ranking received a 0.
Tips For Making the Most of Your Money
- Don’t buy what you can’t afford. No matter where you want to move, it’s important to find a home in your price range. Use SmartAsset’s home affordability tool to see how much house you can realistically budget for.
- Make the most of your money. To make big life decisions like moving or buying a home, it’s not a bad idea to seek out sound and trustworthy advice. Consider using SmartAsset’s free financial advisor matching service. You answer a few questions and we match you with up to three advisors in your area, all fully vetted and free of disclosures. You talk to each advisor and figure out how to proceed.
Questions about our study? Contact press@smartasset.com
Photo credit: ©iStock.com/Vladimir Vladimirov