 Written by
The number of Americans driving to work alone is on the rise, according to data from the U.S. Census Bureau. With the increase in drivers comes traffic, which means more time and money spent idling in cars. Some cities are better equipped to deal with the mass of drivers, managing to keep traffic delays and congestion to a minimum. Other cities are equipped with walkable streets and reliable mass transit options, making car ownership less necessary.
Check out mortgage rates in your area.
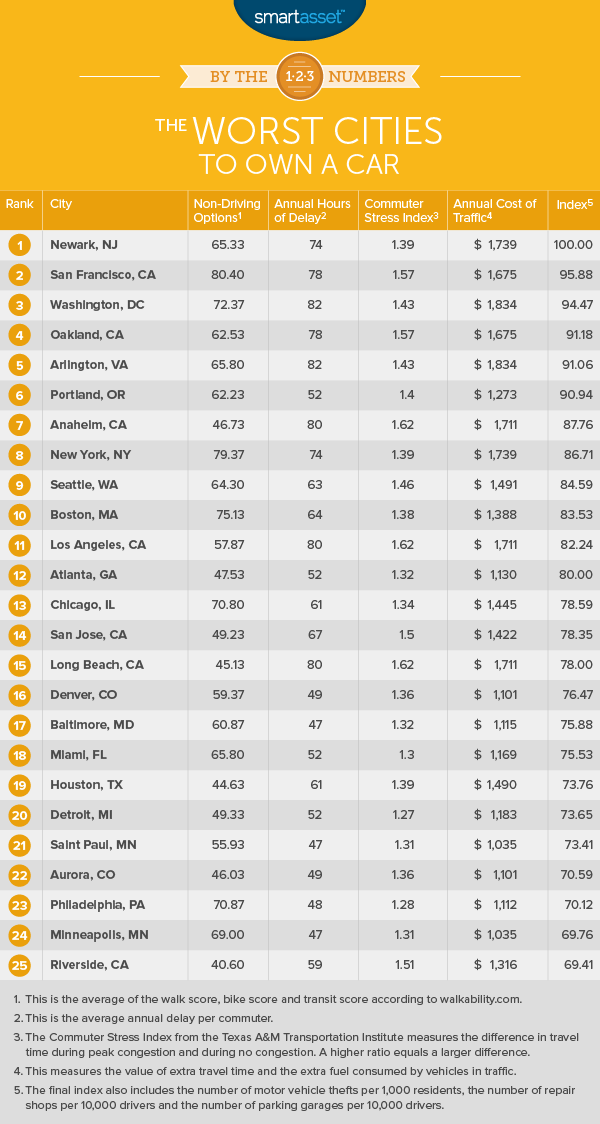
We considered these and other factors to find the worst cities to own a car. Specifically, we looked at hours spent in traffic per year for the average driver, the annual cost of traffic for the average driver, the rate of motor vehicle theft, the number of repair shops and parking garages per driver, the commuter stress index and the non-driving options a resident has for getting around. To understand where we got our data and how we put it together to create our final ranking, see the data and methodology section below.
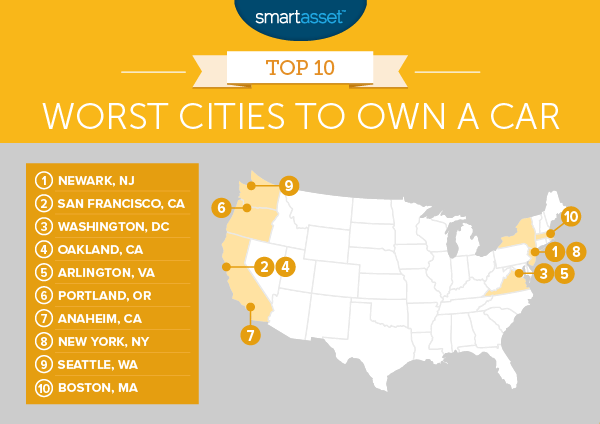
Key Findings
- Cities on the coasts – The entire top 10 is comprised of cities on or close to the coasts. This makes sense as many of the largest cities in the country are located on the coasts. Plus, on the East Coast in particular, these cities tend to be older which means they were not built to handle car traffic.
- Grin and bear it – Traffic can get pretty bad. However, in some cities getting around by car is just about the only option you have if you want to leave your house. Thus some cities with really bad traffic like Los Angeles or Long Beach didn’t quite crack the top 10.
1. Newark, New Jersey
Brick City tops our ranking of the worst cities to own a car. What’s tough about being a car owner in Newark is the traffic. It’s part of the New York City metro area which has 19 million people, 5 million of whom drive to work. Newark is stuck right in the middle of this bumper-to-bumper traffic. Plus, if you’re a car owner in Newark, the risk of having your car stolen is much higher than it is in other cities. Newark ranks eighth in the country for motor vehicle thefts per 1,000 residents.
Related Article: The States With the Worst Drivers
2. San Francisco, California
The City in the Bay grabs the second spot for worst places to own a car. Being stuck in traffic costs the average commuter in San Francisco $1,600 per year. That cost includes both the value of the time spent in traffic and the cost of gas. SF is also one of the 10 worst cities for motor vehicle thefts per resident, another reason to forgo car ownership.
3. Washington, D.C.
The District and the surrounding metro area sees some of the worst traffic in the country. The average D.C. commuter spends 82 hours per year in traffic. Depending on how you slice it, that’s either two working weeks or almost three-and-a-half days of doing nothing but shaking your fist at your fellow drivers. That traffic is equal to an annual cost of $1,834 per commuter.
4. Oakland, California
One argument against car ownership in Oakland is the crime. There were almost 6,400 motor vehicle thefts in the city of Oakland or 15 auto thefts per 1,000 residents. That’s the highest rate in the country. The average Oakland driver can also expect to spend 78 hours per year in traffic. On the plus side, if something goes wrong with your wheels in Oakland, it shouldn’t be too difficult to get it fixed. There are more than six repair shops per 10,000 drivers in Oakland – the highest rate in the top 10.
5. Arlington, Virginia
As previously mentioned, the Washington, D.C. metro area has the worst traffic in the country. Unfortunately for the residents of Arlington, they are a part of that metro area. They face the same brutal 82 hours per year spent in traffic, on average. It costs Arlington residents $1,834 per year, on average, waiting in that traffic. For residents of Arlington, a car is more of a necessity than it is for people living in D.C., which is why it ranks lower in our study.
6. Portland, Oregon
Of all the cities in our top 10, Portland is the least onerous for the driving commuter. Commuters driving around the Portland metro area can be thankful that, on average, they spent only 52 hours per year in traffic. That traffic still costs each driver about $1,200. However, drivers in Portland looking for a parking garage may be out of luck. Portland has the second-lowest number of parking garages per driver in our study, and if you are looking to get your car fixed, Portland ranks in the bottom 13 for repair shops per capita.
7. Anaheim, California
Anaheim commuters are well-acquainted with traffic. Anaheim (and the rest of the Los Angeles metro area) ranks third in average hours per year spent in traffic, first for commuter stress index and fifth for annual cost of idling in traffic. Anaheim only ranks seventh because Walkability.com gives the city a 46 out of 100 for non-driving options. That’s the lowest score in our top 10 meaning, while owning a car here is a pain, not owning one makes getting around a true struggle.
8. New York, New York
New York is the rare American city where public transportation is usually your best bet for getting from point A to point B. All that accessibility makes car ownership unnecessary here. For New Yorkers who do drive, the traffic is not pleasant. New York drivers spend $1,700 per year, on average, waiting in traffic. That’s the third-highest cost in our study.
Not sure if you’re ready to buy in NYC? Check out our rent vs. buy calculator.
9. Seattle, Washington
Seattle has pretty bad traffic. Commuters here probably aren’t surprised to hear the average driver spends 63 hours per year in traffic. And coupled with the traffic is the high number of motor vehicle thefts. Seattle has the fourth-highest rate of motor vehicle thefts per 1,000 residents in the country.
10. Boston, Massachusetts
Boston ranked well in our study on the most livable cities in the U.S. partially based on how easy it is to get around without a car. After New York and San Francisco, Boston is the most walkable city in the country, making the cost of having a car one expense which Bostonians can possibly go without. Although occasionally maligned, the Massachusetts Bay Transit Authority is a great option for commuters who want to avoid the 64 hours per year Boston drivers spend in traffic.
Data and Methodology
In order to rank the worst cities to own a car, we looked at data on the 100 largest cities in the country. Specifically we looked at these seven factors:
- Average total hours commuters spend in traffic per year. Data comes from the Texas A&M Transportation Institute 2014 Mobility Score Card.
- Cost of time spent in traffic per person. This measures the value of extra travel time and the extra fuel consumed by vehicles in traffic. Travel time is calculated at a value of $17.67 per hour per person. Fuel cost per gallon is the average price for each state. Data comes from the Texas A&M Transportation Institute 2014 Mobility Score Card.
- Commuter stress index. This metric is developed by the Texas A&M Transportation Institute 2014 Mobility Score Card. It measures the difference in travel time during peak congestion and during no congestion. A higher ratio equals a larger difference.
- Non-driving options. This metric measures the necessity of owning a car in each city by considering the city’s walk score, bike score and transit score. We found the average of those three scores for each city. Higher scores mean residents are less reliant on cars. Data comes from Walkability.com.
- Motor vehicle thefts per 1,000 residents. Data on population and motor vehicle thefts comes from the FBI’s 2015 Uniform Crime Reporting Program and from local police department and city websites. We used the most up to date data available for cities where 2015 data was not available.
- Number of repair shops per 10,000 drivers. Data on drivers comes from Texas A&M Transportation Institute 2014 Mobility Score Card. Data on repair shops comes from the U.S. Census Bureau’s 2014 Business Patterns Survey.
- Parking garages per 10,000 drivers. Data on drivers comes from Texas A&M Transportation Institute 2014 Mobility Score Card. Data on parking garages comes from the U.S. Census Bureau’s 2014 Business Patterns Survey.
We ranked each city across each factor, giving double weight to non-driving options and half weight to motor vehicle thefts per driver, repair shops per driver and parking garages per driver. All other factors received single weight. We then found the average ranking across each city. Finally we gave each city a score based on their average ranking. The city with the highest average received a score of 100 and the city with the lowest average received a score of 0.
Questions about our study? Contact us at press@smartasset.com.
Photo credit: ©iStock.com/seb_ra