 Written by
The Trump tax bill – formally known as the Tax Cuts and Jobs Act (TCJA) – nearly doubled the standard deduction while also limiting some itemized deductions. From 2017 to 2018, the standard deduction rose from $6,350 to $12,000 for singles, from $12,700 to $24,000 for married couples filing jointly and from $9,350 to $18,000 for heads of household. Additionally, the bill capped state and local tax deductions at $10,000, lowered the mortgage interest deduction and eliminated deductions for casualty losses and miscellaneous expenses.
With the bill’s passage, researchers theorized that these changes would compel taxpayers to switch from itemizing deductions to taking the new higher standard deduction. In this study, we used recently published IRS data to take a closer look at the extent to which Americans switched their itemization statuses. Specifically, we looked at how the distribution of returns claiming itemized deductions changed from 2017 and 2018 and how the share of itemizers changed in different states. For details on our data sources and how we put the information together to create our findings, check out the Data and Methodology section below.
Key Findings
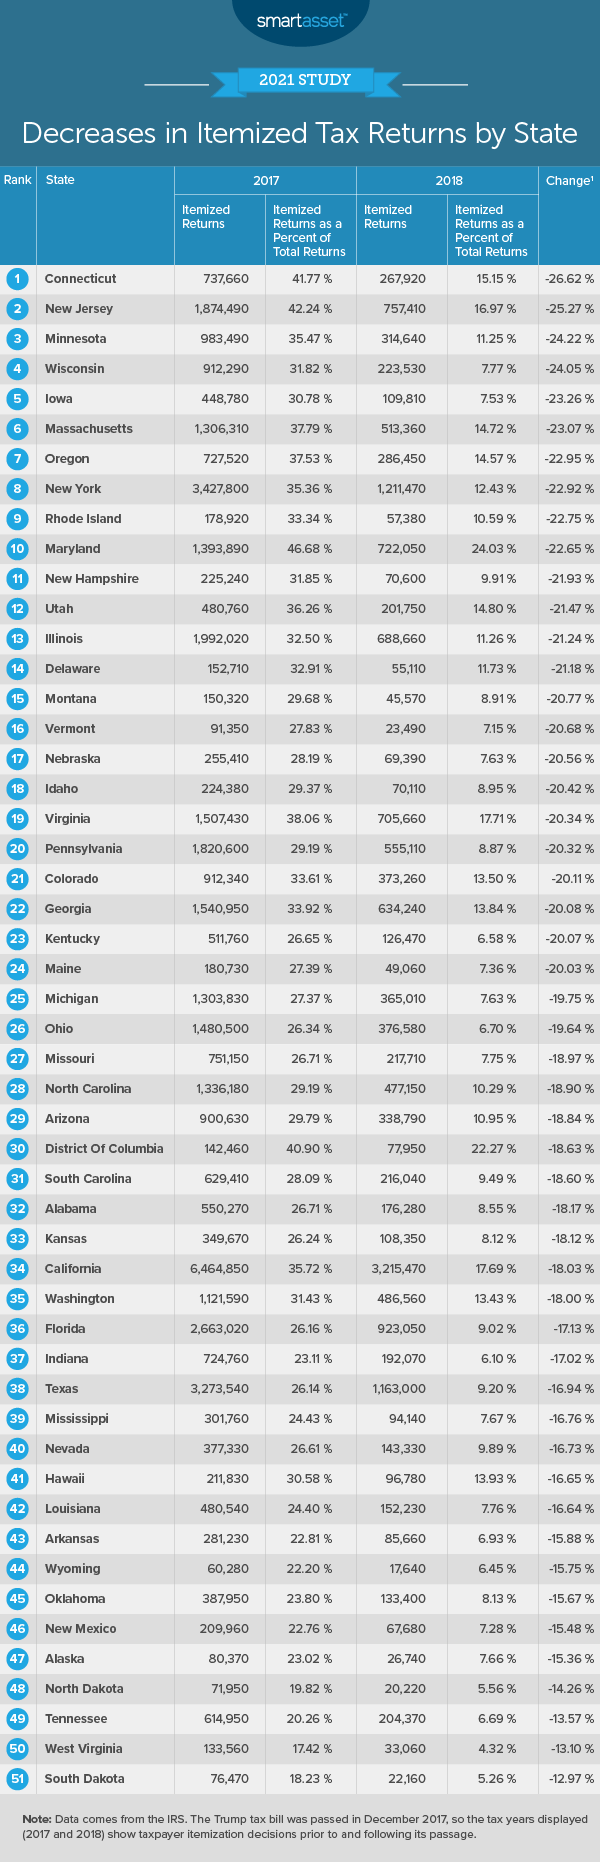
- Less than half as many itemizers. In 2017, 47.1 million taxpayers itemized deductions, relative to 15.3 million in 2018. This dramatic shift maps to a more than 19 percentage point drop in itemizers as a percentage of all taxpayers, from 30.90% to 11.47%.
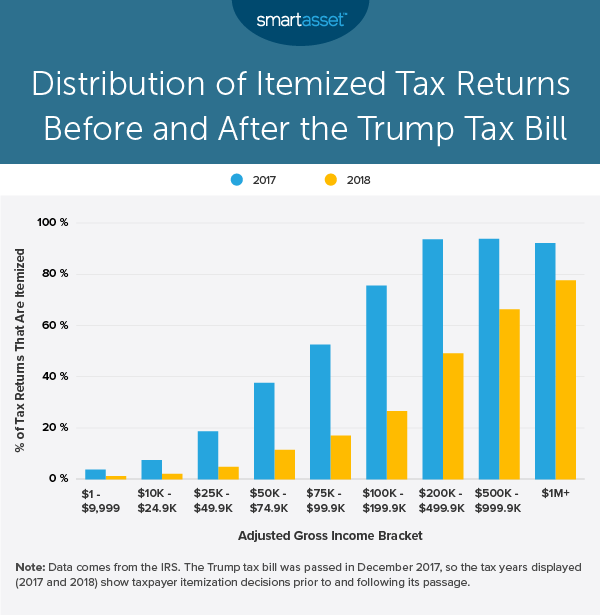
- Upper-middle-class earners were the most likely to take advantage of the higher standard deduction. Almost 76% of taxpayers earning between $100,000 and $200,000 itemized taxes in 2017, as did close to 94% of earners making between $200,000 and $500,000. In 2018, the share of itemizers for each of those adjusted gross income (AGI) tax brackets fell by more than 44 percentage points. IRS data from 2018 shows that 26.62% and 49.10% of taxpayers earning from $100,000 up to $200,000 and from $200,000 up to $500,000, respectively, chose to itemize deductions.
- A tougher choice in states linking federal and state itemization decisions. Across the 44 states with personal income tax, four (Georgia, Maryland, New Mexico, Oklahoma and Virginia) as well as the District of Columbia require that residents match their federal and state itemization statuses. An additional five (Kansas, Maine, Maryland, Missouri and Nebraska) require taxpayers to claim the standard deduction on state returns if they did so on their federal return. In these states, some residents may face a situation where it is better to itemize taxes at the federal level – even if those deductions are lower than the standard deduction – so that they may itemize at the state level and have a lower overall tax burden.
Distribution of Tax Returns Claiming Itemized Deductions
Tax filers with higher incomes remain more likely to itemize deductions (rather than take the standard deduction) after the passage of the Trump tax plan. In 2017, though only about three in 10 total taxpayers itemized deductions, more than nine in 10 taxpayers earning $200,000 or more itemized deductions. In 2018, only about one in 10 total taxpayers itemized deductions, but almost two-thirds of taxpayers earning $200,000 or more chose to itemize.
The drop in itemizers as a percentage of taxpayers is the smallest among filers earning less. IRS data shows that 3.73% of taxpayers earning less than $10,000 itemized deductions in 2017, compared to 1.26% of taxpayers in that same income bracket in 2018. Similarly, 7.53% of taxpayers earning between $10,000 and $25,000 opted out of the standard deduction in 2017, relative to 2.11% of those earners in 2018. The chart below shows the percentage of taxpayers itemizing deductions in 2017 and 2018, according to income.
States With the Largest Decreases in Itemized Tax Returns
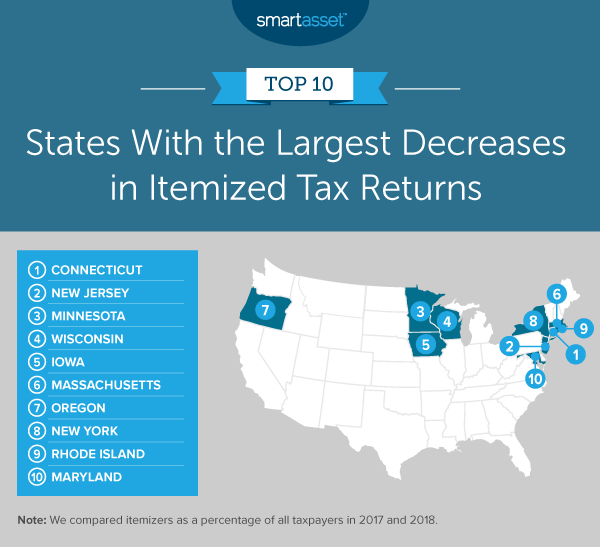
Connecticut ranks as the state with the largest drop in the percentage of itemizers between 2017 and 2018. In 2017, more than four in 10 taxpayers in Connecticut itemized their federal taxes, but in 2018, that figure fell to 15.15%. In other words, more than one in 10 taxpayers changed their itemization status between the two years.
In addition to Connecticut, four other Northeast states – New Jersey, Massachusetts, New York and Rhode Island – rank in the top 10 states with the largest decreases in the share of itemizers. Many of those states saw large decreases because they have a high percentage of upper-middle-class earners relative to other states. According to 2018 IRS data, almost 7% of taxpayers in Connecticut, New Jersey and Massachusetts earned between $200,000 and $500,000. This is higher than the 5.19% national average for other taxpayers. Though Rhode Island bucks the trend, New York also falls higher than the national average with 5.97% of filers earning between $200,000 and $500,000 in 2018.
Beyond Northeastern states, three Midwestern states saw large decreases in itemizers relative to all taxpayers: Minnesota, Wisconsin and Iowa. From 2017 to 2018, the share of itemizers decreased by more than 23 percentage points in all three states. Less than 8% of taxpayers in both Wisconsin and Iowa itemized their taxes in 2018.
States With the Smallest Decreases in Itemized Tax Returns
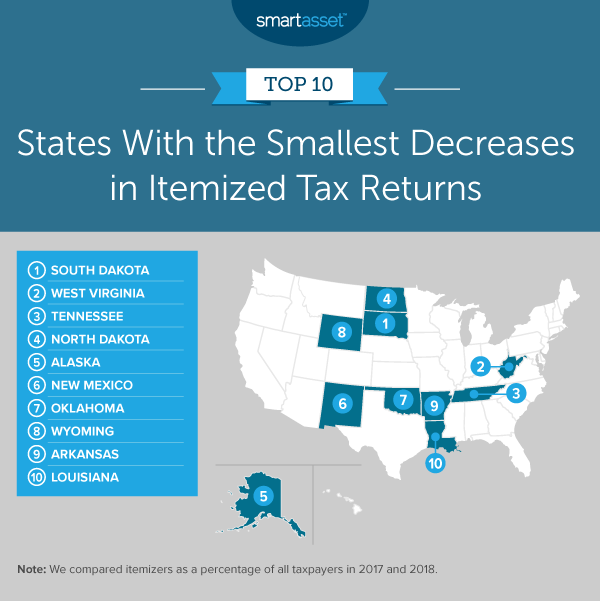
Southern, Midwestern and Western states make up the top 10 states with the smallest decreases in the share of itemizers. South Dakota saw the smallest change between the two years, with a decrease of 12.97 percentage points. In 2017, about 18% of filers in South Dakota itemized deductions, compared to less than 5% in 2018. West Virginia – the state with the second-smallest decrease in itemizers as a percentage of taxpayers – had the lowest rate of itemizers in both 2017 and 2018, with only 17.42% and 4.32% of residents, respectively, choosing not to take the standard deduction.
The four other Southern states include Tennessee, Oklahoma, Arkansas and Louisiana, while the four other Midwestern and Western states include North Dakota, Alaska, New Mexico and Wyoming. As previously noted, residents must match their federal and state itemization status in Oklahoma and New Mexico. Additionally, all 10 states with the smallest decreases in the share of itemizers have fewer upper-middle-class earners than the national average (5.19%). In 2018, the average percentage of taxpayers earning between $200,000 and $500,000 across those 10 states was 3.65%.
Data and Methodology
All data for this report comes from IRS. To find the states with the largest and smallest decreases in the share of itemizers, we compared itemizers as a percentage of all taxpayers in 2017 and 2018. We then calculated the percentage point difference between those two figures.
Tips for Maximizing Your Tax Savings
- Consider working with a financial advisor. In addition to consulting an accountant about your withholdings, a financial advisor can also help optimize a tax strategy for your financial goals. SmartAsset’s free tool matches you with financial advisors in five minutes. If you’re ready to be matched with advisors that will help you achieve your financial goals, get started now.
- Know if itemizing your taxes is the right decision. Be sure that the best tax decision for you doesn’t change after the Trump tax bill changes. Our comprehensive guide walks you through the specifics of the changes and who should itemize deductions going forward.
- Adjust your withholdings. Though many taxpayers look forward to receiving a tax refund, refunds come with a significant financial cost. In fact, filers are often best off if they are paying the correct amount in taxes to the government regularly rather than receiving or owing money during tax season. If you’re on an employer’s payroll, you can adjust the amounts on your Form W-4 to change how much of your paycheck you allocate toward federal, state and local taxes each pay period. Calculate how much will go to the government and how much you’ll take home using our paycheck calculator.
Questions about our study? Contact us at press@smartasset.com.
Photo credit: ©iStock.com/Michael Burrell