 Written by
Before the recent tax bill was passed, there was some discussion around lowering contribution limits on retirement accounts. While no changes on contribution limits made it to the final version of the bill it does lead us to wonder which congressional districts would have been affected the most. Below we look at data on retirement income other economic indicators for seniors to see where they are in the best position to enjoy their golden years.
We analyzed data for the 431 congressional districts for which Census data was available. We ranked how prepared their seniors were for retirement by analyzing data on six metrics. Specifically, we looked at data on average retirement income, percent of seniors with retirement income, poverty rate for seniors, percent of seniors on food stamps, percent of seniors who own their home and percent of seniors who are housing cost-burdened. Check out our data and methodology section below to see where we got our data and how we put it together.
Key Findings
- New York districts score poorly – Six of the bottom 10 congressional districts in this study were located in New York. In particular the less wealthy districts in New York City scored poorly. New York’s 15th and 13th congressional districts both scored in the bottom three.
- Southern districts score well – Virginia is home to three districts in the top 10. South Carolina also did well with two districts in the top 10. Add in one for Texas and one for Florida and Southern congressional districts took seven of the top 10 spots.
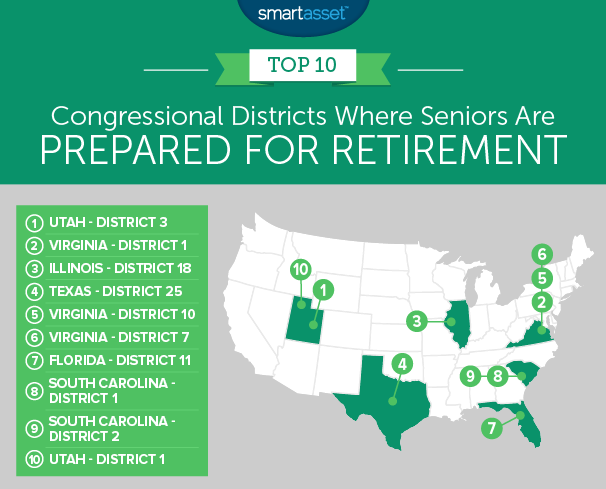
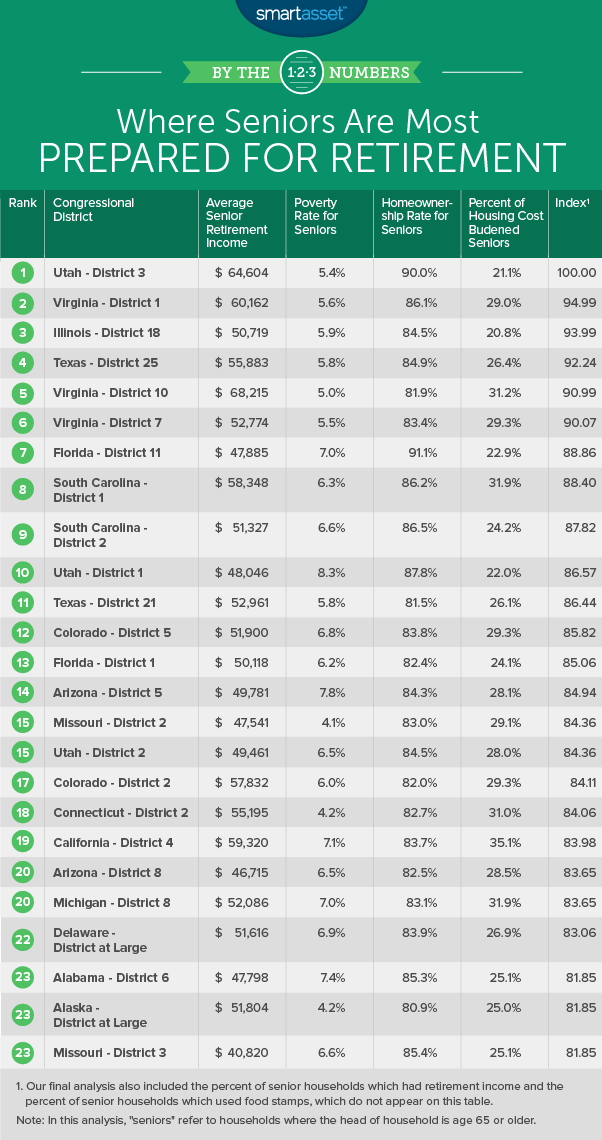
1. Utah – District 3
Utah’s third district tops our ranking. This is a Republican-leaning district currently represented by John Curtis. According to Census Bureau data, 90% of seniors here own their homes, the second-highest rate in our study. Homeownership is good for seniors looking to retire. It means long-term housing costs are kept low.
The average senior household here has a combined income of $64,600 between Social Security income and private retirement income. For that metric, this district ranks seventh.
2. Virginia – District 1
Seniors in Virginia’s first district have an average retirement income over $60,000, good enough for 14th in that metric. Most seniors here have kept an eye out for their retirement. Just under 60% of senior households have some retirement income, a top 20 score.
One area of concern might be the number of housing cost-burdened seniors. Just under 29% of senior households are housing cost-burdened.
3. Illinois – District 18
Illinois’ 18th congressional district lies in central and western Illinois. It covers Jacksonville, Quincy and parts of Bloomington and Peoria. This district has been represented by a Republican in Congress since 1939.
It has the lowest percent of housing cost-burdened seniors in the top 10 at 21%. Furthermore around 57% of seniors have some retirement income, a figure which beats 90% of districts in the study.
4. Texas – District 25
Texas’ 25th congressional district is located in central Texas and runs from Fort Worth to Austin. It is currently represented by Republican Congressman Roger Williams. The district has some of the lowest rates of senior poverty in our study. Less than 6% of seniors find themselves below the poverty line.
Another impressive metric in this district’s favor is the fact that less than 4% of senior households rely on food stamps, a score which beats 90% of congressional districts in this study.
5. Virginia – District 10
Virginia’s 10th congressional district is home to senior households with some of the highest retirement income in the country. According to our data, the average senior household has $68,200 between private retirement income and Social Security income. Only five districts have income numbers which beat that figure.
Despite the high incomes, housing costs in this district can be a burden. Around 31% of senior households spend more than 30% of their income on housing.
6. Virginia – District 7
Virginia’s seventh congressional district is another one which leans Republican. President Trump won the district by 6% in 2016. Around 59% of senior households here have some retirement savings. For that metric, it ranks 30th.
While seniors here don’t earn quite as much retirement income as seniors in the Virginia districts ranked above, it still scores above-average in that metric. According to our data, the average senior household here has just under $53,000 in retirement income and Social Security income.
7. Florida – District 11
Florida’s 11th district takes the seventh spot. This is a district of 758,000 residents represented by Republican Congressman Daniel Webster. Over 91% of senior households here own their homes, the most in the study. Seniors also manage to keep housing costs under the affordability line, on average. According to Census Bureau data, less than 23% of seniors are housing cost-burdened.
However it is worth noting that on average senior households here don’t have particularly high incomes. The average senior household has $47,800 between Social Security income and personal retirement income. For that metric, Florida’s 11th congressional district ranks around the middle of the pack.
8. South Carolina – District 1
Two South Carolina districts are next up. South Carolina’s first congressional district beats the second district by 0.6 points on our index. The first congressional district lies on some of the state’s highest cost-of-living areas along its southeast coast, including parts of Charleston.
The average retired household here has about $58,000 in retirement income, a top 25 score. Another metric in this district’s favor is the homeownership rate among seniors. According to our data, over 86% of seniors own their home.
9. South Carolina – District 2
As mentioned in the last blurb, it is a close race between two South Carolina districts for the eighth and ninth spot. This district has been represented by Republican Congressman Joe Wilson since 2001. South Carolina’s 2nd district has a relatively low number of housing cost-burdened seniors. Census Bureau data shows that only 24% of senior households here spend over 30% of their income on housing.
This district also scores well in homeownership rate for seniors. Our data shows over 86% of seniors own their home.
10. Utah – District 1
Our list ends in Utah. According to our data, over 62% of senior households have some retirement income, the fourth-highest rate in our study. And just under 88% of seniors also own their home, the fifth-highest rate in our study. Those two top 10 scores are enough to catapult this district to 10th place.
One metric where this congressional district lags behind others in the top 10 is in average retirement income. Between Social Security and retirement income the average senior household here has about $48,000. That is an average score compared to other districts.
Data and Methodology
In order to rank the congressional districts where seniors are prepared for retirement, we looked at data for all 431 congressional districts for which Census data was available. We then ranked them using the following six metrics:
- Average senior retirement income. This is average private retirement income, from savings, IRAs, 401(k) or pensions, combined with average Social Security income for households where the head of household is 65 or older.
- Percent of seniors under the poverty line. This is the percent of seniors who fall under the poverty line.
- Percent of seniors who use food stamps/SNAP benefits. This is the percent of households who use food stamps where the head of household is 65 or over.
- Percent of seniors who own their homes. This is the percent of households where the where the head of household is 65 or over and own their homes.
- Percent of seniors with retirement income. This is the percent of households where the head of household is 65 or over who have retirement income from private means. It includes money from income streams like annuities, insurance, IRAs and retirement pensions.
- Percent of seniors who are housing cost-burdened. This is the percent of households where the head of household is 65 or over and spends 30% or more of income on housing.
Data for all metrics comes from the U.S. Census Bureau’s 2016 1-Year American Community Survey.
Tips for Hitting Your Retirement Goals
Ensuring a secure retirement involves saving early and saving often. The earlier, and the more often, the better.
Here is an example: let’s say you are a 30-year old living in New York earning $55,000 per year and have $10,000 saved. Are you on pace for a secure retirement? Well if you managed to save 15% of your income per year, invested it with an average rate of return on investment of 4%, took Social Security at 65 and cut retirement expenses to $3,000 per month, our retirement calculator estimates that you will be on track to meet your retirement goals.
In that above example there are a few variables. Some, like Social Security election age, you have control over. Others, like retirement expenses, savings rate and average rate of return, you have some but not total control over. Despite not having full control over these variables there are ways to make the math lean in your favor. For example, when it comes to investing your assets it can make sense to hire a financial advisor. Financial advisors come with a range of skills, from estate planning to asset management. Finding the right advisor can help you get on a path to hitting your retirement goals.
It’s also important to carefully consider your Social Security election age. There is no specific election age which makes the most sense for everyone (you can start collecting Social Security anytime between ages 62 and 70). The longer you wait to elect to take Social Security, the larger your Social Security check, which will maximize your long-term income. However in order to receive the largest checks you have to endure multiple years of no Social Security income. If your finances are not secure enough to wait or if you are in poor health, it may make more sense to take Social Security earlier.
Questions about our study? Contact us at press@smartasset.com.
Photo credit: ©iStock.com/Johnny Greig