 Written by
Many Americans see housing as a more preferable investment when compared to the stock market, according to recent survey data from the Federal Reserve Bank of New York. Of respondents surveyed in 2020 and 2021, more than 90% would buy a house as a primary residence over investing in the stock market and more than 50% would invest in a rental property over the stock market. High housing demand throughout the coronavirus pandemic is also evidenced by Census Bureau and National Association of Realtors data. From February 2020 to February 2021, new homes sales increased by 8.2% and existing home sales rose 9.1%.
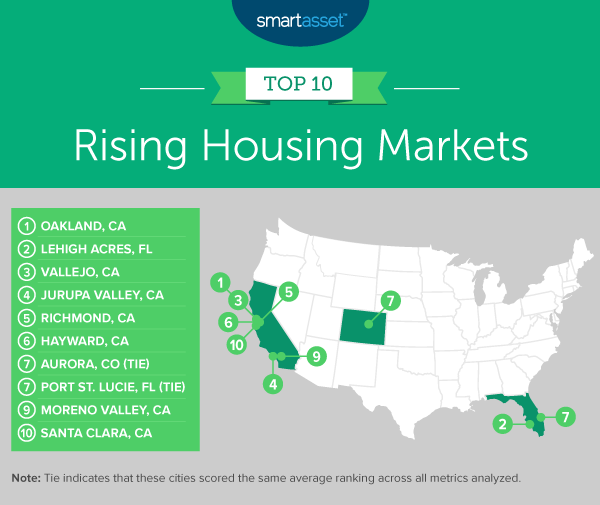
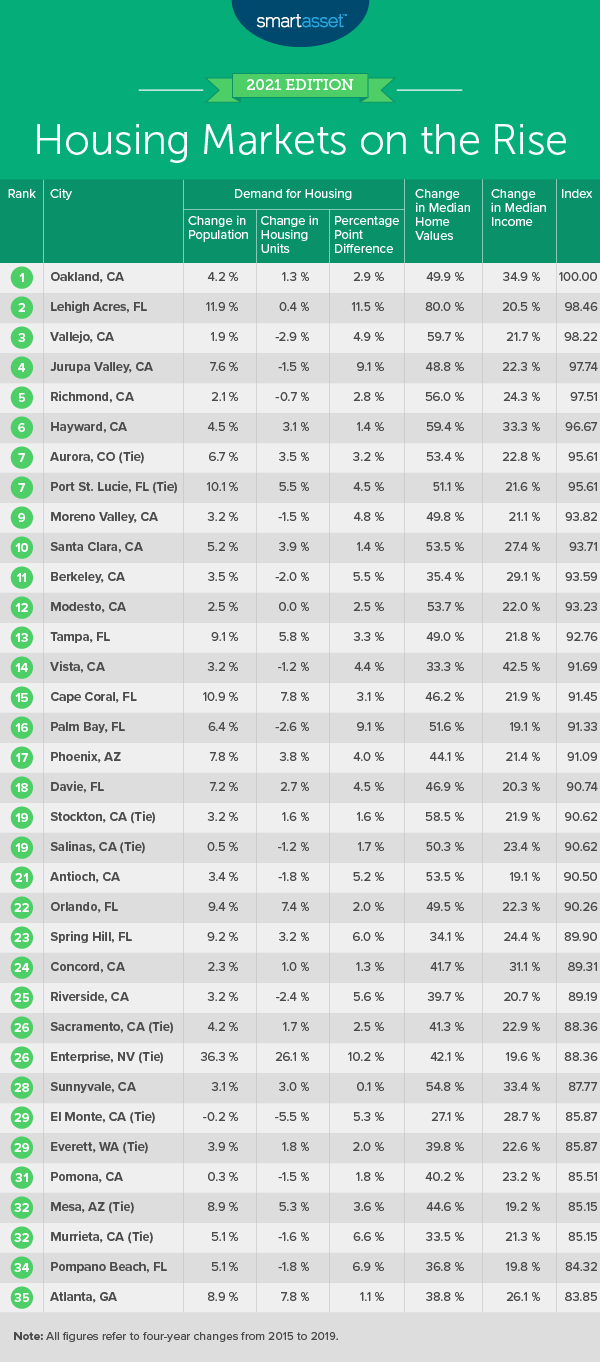
In this study, SmartAsset identifies the top 10 rising housing markets leading up to COVID-19. We analyzed 321 cities and compared them across the following metrics: difference between population growth and housing unit growth, four-year change in median home value and four-year change in median household income. For details on our data sources and how we put all the information together to create our final rankings, check out the Data and Methodology section below.
This is SmartAsset’s fifth annual study of the top 10 rising housing markets. Check out the 2020 version here.
Key Findings
- California is home to the most rising housing markets. Seven California cities rank in the top 10 of this study. These include Oakland, Vallejo, Jurupa Valley, Richmond, Hayward, Moreno Valley and Santa Clara. All seven cities rank within the top 10% of the study for their high four-year changes in median home value (almost 54% on average). Golden State cities also dominate beyond the top 10, as 20 out of the top 35 rising housing markets are in California.
- There are more housing units nationwide. The average number of housing units – which includes homes, apartment units and mobile homes – has increased 3.65% over the past four years. The city with the biggest jump in the number of housing units is in Sugar Land, Texas, which saw an increase of more than 42%.
1. Oakland, CA
Oakland, California is the fastest-rising housing market in this study. This city’s population has grown 2.88 percentage points faster than the number of housing units, ranking 46th for this metric on our list. Oakland’s median household income has grown 34.92% over that time period, placing fourth in the study.
2. Lehigh Acres, FL
Lehigh Acres, is the first out of two Florida cities in the top 10 (and one of only three located outside of California). This city’s population has grown 11.53 percentage points faster than the number of housing units, ranking first for this metric in our study. Lehigh Acres also has the highest four-year change in home value (79.95%), but ranks outside of the top quartile in the four-year change in median household income (20.53%).
3. Vallejo, CA
Vallejo, California has the fourth-highest four-year change in median home value out of all the cities that we analyzed, jumping 59.69% from 2015 to 2019. This city’s population has also grown 4.85 percentage points faster than the number of housing units, which is the 19th-biggest change on our list.
4. Jurupa Valley, CA
Jurupa Valley’s population has grown 9.05 percentage points faster than the number of housing units, ranking sixth on this list. This city also has the 31st-biggest four-year change in median home value (48.83%) and the 58th-highest four-year change in median household income (22.33%).
5. Richmond, CA
Richmond, California has the ninth-highest jump in median home value out of all the cities that we analyzed, jumping 55.97% from 2015 to 2019. This city also has the 41st-highest increase in our study for household income, jumping 24.26% during that same time period.
6. Hayward, CA
Hayward, California has the fifth-highest change in median home value, 59.41% in the four-year period from 2015 to 2019. And this city also has the seventh-biggest increase in median household income, going up 33.26% over those four years.
7. Aurora, CO (tie)
Aurora, Colorado is the second of only three cities in our top 10 that is located outside of California. It has the 17th-biggest four-year change in median home value, jumping 53.36%. And this city’s population has grown 3.24 percentage points faster than the number of housing units, which ranks 41st on our list.
7. Port St. Lucie, FL (tie)
Port St. Lucie is the second city in our top 10 that is located in Florida. It has the 21st-highest four-year change in median home value (increasing 51.13% from 2015 to 2019). And this city’s population has grown 4.54 percentage points faster than the number of housing units in that time period, ranking 23rd for this metric.
9. Moreno Valley, CA
Moreno Valley, California’s population has grown 4.78 percentage points faster than the number of housing units, ranking 21st in our study. And this city also has the 27th-biggest change in median home value, increasing 49.78% in four years.
10. Santa Clara, CA
Santa Clara, California rounds out the top 10 with a 53.50% increase in home value over the past four years, the 14th-biggest jump in this study. And this city also has the 19th-biggest change in median household income, going up 27.39%.
Data and Methodology
To find the top rising housing markets, we looked at data for the 321 U.S. cities with a population greater than 100,000 in 2019. We analyzed this information across the following three metrics:
- Housing demand. This is the percentage point difference between population growth and housing unit growth from 2015 to 2019.
- Home value growth. This is the percentage change in median home values from 2015 to 2019.
- Income growth. This is the percentage change in median household income from 2015 to 2019.
Data for all metrics comes from the Census Bureau’s 2015 and 2019 5-year American Community Surveys.
First, we ranked each city in each metric. Then we found each city’s average ranking, giving each metric equal weight. Using this average ranking, we created our final score. The city with the highest average ranking received a score of 100. The city with the lowest average ranking received a score of 0.
Financial Planning Tips
- Thinking of buying a home? Strengthen your financial foundation. The switch to homeownership is a big decision, and one where some help planning your finances could be a good idea. Finding the right financial advisor doesn’t have to be hard. SmartAsset’s free tool matches you with financial advisors in just five minutes. If you’re ready to be matched with advisors that may be able to help you achieve your financial goals, get started now.
- To buy or to rent? Depending on your situation, buying a house may not be the right decision. Figure out whether you should rent or buy early in the process to make everything go smoothly.
- Efficient mortgage management. A mortgage can be one of the biggest parts of a families monthly expenses. Find out what yours might look like with SmartAsset’s free mortgage calculator.
Questions about our study? Contact press@smartasset.com.
Photo Credit: © iStock/Paul Hamilton