 Written by
Happiness in the United States is the lowest it’s been in a decade, according to the 2017 World Happiness Report from the United Nations. Even so, the U.S. still ranked 14th on the list that considered 155 nations. But that’s on a country level, what about within the country? Which counties across the U.S. rank as the happiest places in America in 2017? Read on to find out!
Considering a move? Check out current mortgage rates.
Key Findings
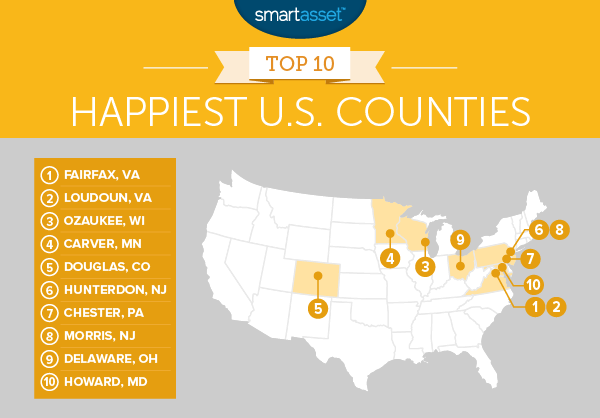
- Virginia reigns as the place for happy people – For the second year in a row, the two happiest places in America are in Virginia. You already knew Virginia is for lovers, but it’s also a great destination for happy people.
- The Deep South continues to struggle – Fourteen of the bottom 20 places in our study are in Alabama, Georgia and Louisiana. This is not the first time we have seen this trend so here’s to hoping the Deep South can make some changes for 2018.
- Double happiness for New Jersey – Besides Virginia, New Jersey is the only state to have two counties appear in the top 10. Hunterdon County and Morris County ranked sixth and eighth, respectively.
- People in the West are more active – The Western U.S. may not have many places in our top 25, but it is more active than the East. Of the top 10 places in America where people get their recommended level of physical activity, seven are in Western states. Colorado is particularly strong with three of the top five most active. Oregon and California did well, too.
This is SmartAsset’s third annual happiest places study. You can find the 2016 edition of our happiest places in America study here.
1. Fairfax County, Virginia
Fairfax County continues to rise in our rankings. After finishing third in 2015, and second in 2016, it is now in first. What’s causing this rise? For one, unemployment is down to just 3%. The poverty rate and rate of personal bankruptcy filings have also decreased from 2016. At the same time, life expectancy rose to 83.7 years, and continues to be the highest in our top 10.
This high life expectancy might be due in part to the fact that 62.9% of Fairfax County residents get the recommended amount of physical activity each week. This is an increase from 2016 and one of the five highest rates in Virginia.
Fairfax County also has one of the lowest divorce rates in our study and families likely enjoy the county’s strong blend of metropolitan, suburban and residential spaces. So if you’re looking for a place to be with happy people, Fairfax County may be your best bet!
2. Loudoun County, Virginia
After two years as number one in our rankings, Loudoun County fell one spot to second place. Our metrics show that life in Loudoun County is largely the same as in 2016. The county’s poverty rate of 4% was tied for the lowest in our study. More than that, Loudoun County’s median household income of $123,453 is the highest in Virginia and among the nation’s highest. Add the highest income-to-cost ratio in Virginia, and a happy life is also affordable in Loudoun County.
Loudoun County has experienced huge population growth over the past couple of decades but unemployment is trending down, sitting at only 3%. The area also saw increases in life expectancy and the percentage of people getting enough weekly physical activity.
3. Ozaukee County, Wisconsin
Ozaukee County made a big jump to go from 10th in 2016 to third in our 2017 rankings. One reason for Ozaukee County’s rise is that unemployment in the county is at only 2.8%. That’s a 1.6% drop from last year and is the second-lowest rate in Wisconsin. Couple that with Wisconsin’s second-highest income-to-cost ratio, and living happily is well within reach for many Ozaukee County’s residents.
Almost 64% of of people in Ozaukee County get adequate physical activity, good for second in our top 10. This is no surprise given the county’s location on Lake Michigan. It isn’t just about beautiful, sandy beaches though. Hikers and bikers enjoy the Ozaukee Interurban Trail, a 30-mile trail that spans the entire length of Ozaukee County. This trail provides access to some of the area’s abundant nature and wildlife, which Ozaukee County makes a great effort to protect.
4. Carver County, Minnesota
Coming in at fourth is Carver County, Minnesota. The county boasts an unemployment rate of just 3.6%, and its 4.4% poverty rate is the third-lowest in our study. Carver County’s income-to-cost-of-living ratio of 1.74 is the second-highest in Minnesota.
The county also has stable families with a 62.3% marriage rate, and Minnesota’s eighth-lowest divorce rate at just 8%. People in Carver County enjoy an average life expectancy of 82.8. That’s an increase of 1.4 years from 2016 – the largest increase in our top 10.
5. Douglas County, Colorado
Douglas County moved up three spots from our 2016 rankings and is the westernmost place to rank in this year’s top 10. Unemployment in Douglas County is a mere 2% and the poverty rate is 4%. These rates rank second-lowest and lowest in our entire study, respectively. Coupled with our study’s sixth-highest income-to-cost-of-living ratio, it’s easy to see why people are flocking to Douglas County.
There’s more to life than just work though. Nearly 70% of Douglas County residents get their weekly amount of recommended physical activity. This is one of the five highest rates in the study and easily the highest in our top 10. This high rate of exercise could be why Douglas enjoys a life expectancy of 83.7 years. That’s second in our top 10 behind only Fairfax County, Virginia.
6. Hunterdon County, New Jersey
Hunterdon County enjoys a high income-to-cost-of-living ratio at 1.96. Combined with an unemployment rate of only 3.3% and the third-lowest poverty rate in our study (4.4%), it’s no wonder people are so happy in Hunterdon County.
The county’s current life expectancy is 82.5 years. Hunterdon County experienced the third-largest growth in life expectancy in our top 10. A contributing factor may be that more people are getting active than in 2016. The percent of people getting adequate physical activity increased to 63.3%. This shouldn’t be a surprise considering the abundant hiking trails, bicycle paths and beautiful parkways.
7. Chester County, Pennsylvania
Chester County stays in our top 10 for a third year to show that its residents are still enjoying life very much. For one thing financial health is strong in Chester County. The personal bankruptcy rate is only 0.11%. That’s the lowest in our top 10. Chester County also has the highest median household income of all Pennsylvania counties and unemployment is down to just 3.5%.
Plus the county is an active one with 62.2% of people getting their weekly exercise. The county also saw an increase in life expectancy after no increase between 2015 and 2016.
8. Morris County, New Jersey
The unemployment and poverty rates in Morris County are down from 2016. It has the third-highest median income in New Jersey, and life is affordable with the highest income-to-cost ratio in New Jersey (1.97).
Life expectancy has increased from 2016. Morris County has the third-highest life expectancy in the state. People are also getting more active in Morris County. With hiking, arboretums, museums and plentiful winter activities, Morris County remains the second-most physically active place in New Jersey.
Maybe all these factors help contribute to Morris County having the third-lowest divorce rate in New Jersey and the second-lowest in our top 10.
9. Delaware County, Ohio
After barely missing the top 10 in 2016, Delaware County, Ohio is back in the thick of it this year. Life is generally affordable in Delaware County with an income-to-cost ratio of 2.10. This is the third-highest in our study and the highest in Ohio. The good news doesn’t end there. Unemployment is down to just 3.3%. The poverty and personal bankruptcy rates are also lower.
These monetary successes might play a part in Delaware County’s increased family stability. The county has the second-highest marriage rate in Ohio and the fourth-highest in the study.
10. Howard County, Maryland
Howard County remains a destination for happy people with its third straight year in our top 10. The area experienced the second-largest increase in life expectancy from 2016 out of our top 10. People now enjoy a life expectancy just under 83 years, the highest in Maryland by a good margin. Howard County also has Maryland’s third-highest percentage of people getting adequate physical activity (59.4%).
It’s not just about living a long life. Many residents can afford to live comfortably with an income-to-cost ratio of 2.02. Howard County is the only place in Maryland with a ratio over two. Throw in the highest marriage rate and lowest divorce rates in Maryland, and you have some happy, stable families.
Data and Methodology
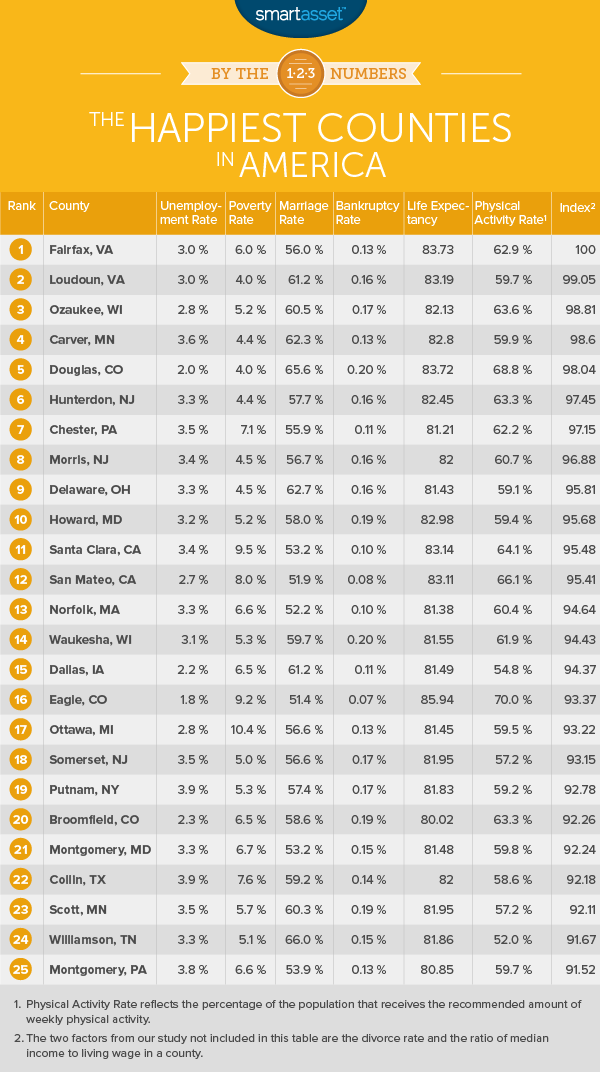
To find the happiest places in America, SmartAsset created an index to rank the happiest counties in the U.S. We pulled data from several sources and used eight metrics to create our index.
We used two metrics to gauge physical health: average life expectancy and the percentage of the population receiving the recommended weekly exercise. (The National Health Service recommends 150 minutes of moderate physical activity, 75 minutes of rigorous activity or some combination thereof each week.) Both of these metrics were calculated using data from the Institute for Health Metrics and Evaluation (healthdata.org).
Two metrics were used to calculate personal financial health: personal bankruptcy rate and the ratio of median household income to cost of living (the minimum income needed to afford basic necessities). Data for personal bankruptcy filings came from uscourts.gov. Median household income data came from the Census Bureau’s 5-Year American Community Survey (2011-2015). Cost of living data came from MIT’s living wage calculator. We used the living wage income for two adults and one child as our cost of living baseline. Unlike 2016, MIT’s living wage calculator specifies whether one or both parents is working. We used data for only one working parent. We divided median income by cost of living to get the income ratio for each county.
Divorce and marriage rates allowed us to gauge family stability. We calculated both rates with data from American Community Survey (2011-2015).
A county’s overall economic strength came from data on unemployment and poverty rates. For up-to-date unemployment data, we used the Bureau of Labor Statistics’ Local Area Unemployment Statistics (February 2016-March 2017). We collected poverty rate data from the American Community Survey (2011-2015).
To create our happiness index we combined all eight metrics, giving them equal weight. To narrow the scope of our study, we set a minimum population of 50,000, the same minimum used in last year’s study. Population data came from the American Community Survey (2011-2015). We further narrowed the scope by eliminating counties that didn’t have data for all eight metrics. This left us with 980 counties.
To create a happiness index, we individually ranked each county on each metric and then gave each county an average ranking based on all eight metrics. We applied an index score between 0 and 100 using that average ranking. The highest-ranking county received a score of 100 and the lowest-ranking county received a score of 0.
The data analysis for this study was completed by Nick Wallace.
Questions about this study? Contact us at press@smartasset.com
Photo credit: ©iStock.com/monkeybusinessimages