 Written by
The number of multi-generational households in the U.S. is on the rise. Between 1980 and 2012 the number of Americans living in multi-generational households doubled, to 57 million. For reasons both cultural and economic, the trend of having three generations under one roof has continued in the years since. SmartAsset crunched the numbers to find the best cities for multi-generational households.
Find out now: How much house can I afford?
What’s driving the rise of multi-generational households? The economy, for one. During the 2007-2009 recession the number of multi-generational households spiked as families saved on housing costs, child care and elder care by moving in together.
It’s not just the oldest generation that moves in with kids and grandchildren. In fact, young people moving back to their parents’ homes are driving the trend.
Aside from economic factors there are cultural factors at work, too. Asian-American and Hispanic families are generally more likely to favor multi-generational households. Recent immigrants from all backgrounds are also more likely to live in multi-generational households.
Also contributing to the rise in multi-generational households is the fact that Americans are marrying later. As young Americans delay forming their own households with a spouse they’re more likely to stay in (or return to) their parents’ homes. Some bring children with them, giving rise to multi-generational households.
Methodology
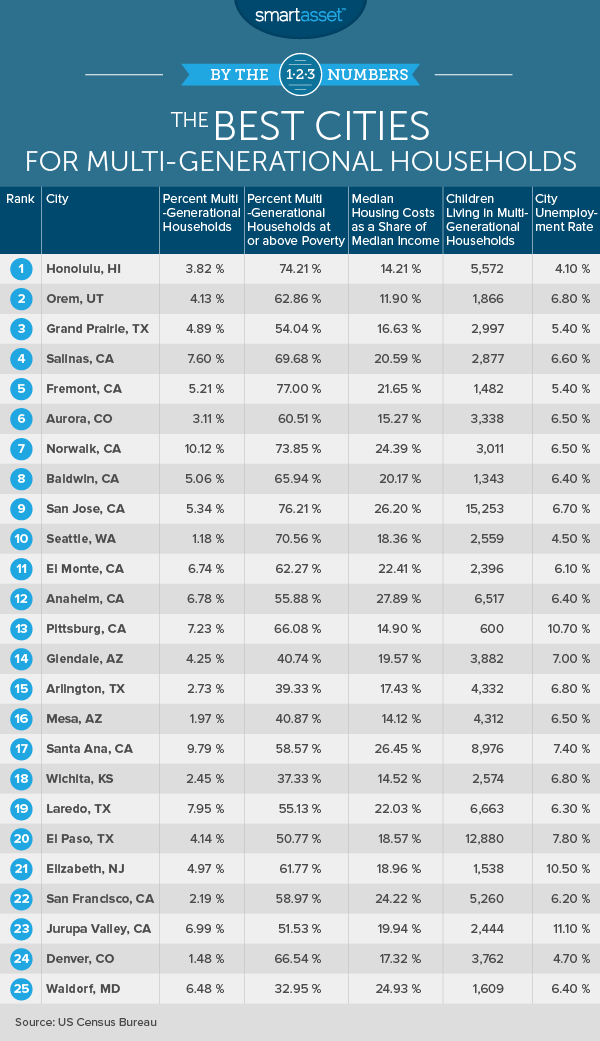
So what makes a city good for multi-generational households? Our study looked at a combination of factors specific to multi-generational families, as well as general economic factors. The five factors we considered were: 1) the percentage of households that are multi-generational 2) the percentage of multi-generational households living at or above the poverty level 3) median housing costs as a percentage of the median income of multi-generational households 4) the number of children living with their grandparents in a three-generation household and 5) the city’s unemployment rate.
In our ranking, cities with a higher percentage of multi-generational households, a higher percentage of those households living at or above the poverty level and a higher number of children living with their grandparents in three-generation households (as opposed to living with their grandparents without a parent present) all ranked higher. Cities with lower unemployment rates and a lower ratio of median housing costs to median multi-generational household income ranked higher as well.
It’s important to note that there are many kinds of multi-generational households. In some, the parents are present only intermittently and the grandparents are responsible for their grandchildren. Some households are headed by the middle generation while others are headed by the oldest generation.
For the purposes of our study, SmartAsset looked at households where the grandparents are not responsible for their grandchildren. We did this to eliminate households that are either two-generation households with just grandchildren and grandparents and to eliminate households where the grandparents are the primary caregivers. We wanted to look at families where the parents are responsible for their own children but the oldest generation is present in the household. For that reason, the percentage of multi-generational households in our study is likely lower than the percentage using a more all-encompassing definition of “multi-generational household” would be.
For each of the 177 cities for which we had data on all five factors we ranked the cities on each of the five factors. We then averaged those ranks to get on average rank for each city and re-ranked based on that average. You can read the full methodology below.
Key Findings
- California takes the crown. Five of the cities in our top ten are in California. One possible explanation? Hispanic families tend to form multi-generational households at much higher rates than non-Hispanic whites, and California boasts a large Hispanic population. Together, California and Texas dominated our top 25 list.
- The East Coast falls behind. No East Coast cities made our list of the top ten cities for multi-generational households, and only two East Coast cities (Elizabeth, NJ and Waldorf, MD) made the top 25. Though our study found several East Coast cities with a high proportion of multi-generational households, these cities tended to fall behind when it came to housing costs/income and the poverty rate of multi-generational households. For example, 6.31% of Paterson, NJ households are multi-generational by our definition, but housing costs are 41% of median income, meaning these households are housing cost burdened.
- Multi-generational households are still a niche. Yes, the number of multi-generational households nationwide is growing. However, the proportion of multi-generational households is still low – for now. The 177 cities in our study averaged just 3.3% multi-generational households (using our definition of the term). However, as the phenomenon gains popularity and construction and zoning norms catch up, that number is projected to grow. Of the cities in our study, the one with the highest proportion of multi-generational households was South Gate, CA, where 14.87% of households are multi-generational.
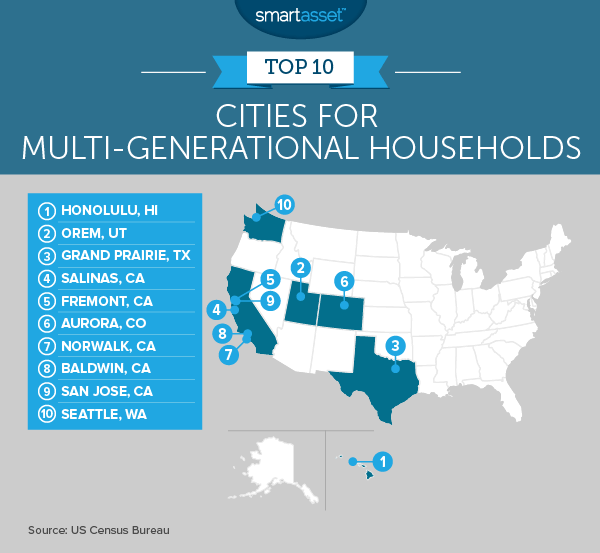
1. Honolulu, HI
Number one in our study of the best city for multi-generational households is Honolulu, HI. In beautiful Honolulu, 3.82% of households are multi-generational and 74.21% of those households are at or above the poverty level. Honolulu’s median housing costs make up just 14.21% of the median income of multi-generational households.
5,572 children live in households with grandparents who are not responsible for their care and the unemployment rate is just 4.1%. As of the 2010 Census, 54.8% of Honolulu’s population was Asian-American, which may account for the high number of multi-generational households in the city.
2. Orem, UT
In Orem, UT 4.13% of households are multi-generational and 62.86% of those households are at or above the poverty level. In 2011 the Salt Lake Tribune caught wind of the trend, reporting that Census Bureau data showed a 50% jump in Utah’s multi-generational households between the 2000 and 2010 censuses.
3. Grand Prairie, TX
In Grand Prairie, TX, 4.89% of households are multi-generational. 42.7% of the city’s population is Hispanic, which may contribute to the relatively high number of households with three generations living under one roof. In Grand Prairie’s most recent Comprehensive Plan for the city, a stated goal was to: “Provide ordinance provisions that allow multi‐generational housing options that are socially cohesive, reduce isolation, foster community spirit, and permit sharing of resources.”
Related Article: The Best Cities for Living the American Dream
4. Salinas, CA
In Salinas, CA, 7.6% of households meet our standard for a multi-generational household. 69.68% of those households are at or above the poverty level. The 2010 census found that Salinas has a high proportion of households (30.4%) that are what are called “large households.” These can be multi-generational households, households where uncles and cousins and other extended family live together or households where multiple families live together to save money.
5. Fremont, CA
In Fremont, CA 5.21% of households are multi-generational by our definition. 77% of multi-generational households in the city are at or above the poverty level. Median housing costs make up 21.65% of the median income of multi-generational households, which is below the 30% standard the government uses to determine whether families are housing cost burdened.
6. Aurora, CO
4.33% of Aurora, CO households are multi-generational by our metric and over 60% of those households live at or above the poverty level. Aurora also made the top ten in our study of the Best Cities for Living the American Dream.
7. Norwalk, CA
Norwalk is another predominately Hispanic California city that made our list of the best cities for multi-generational households. Of the cities in our study, Norwalk had the fifth-highest percentage of multi-generational households living at or above the poverty level. The suburban city located in Los Angeles County also had the third-highest percentage of multi-generational households in our study.
8. Baldwin Park, CA
Also in Los Angeles County is Baldwin Park, which came in at #8 on our list. 5.06% of households are multi-generational by the standard we used in this study. Just shy of 66% of those households live at or above the poverty level.
9. San Jose, CA
In wealthy San Jose, 5.34% of households are multi-generational. 76.21% of those households live at or above the poverty line, the second-highest percentage in our study. San Jose also has the ninth-highest number of children living in multi-generational households in our study.
Related Article: The Cost of Living in California
10. Seattle, WA
Rounding out our list at #10 is Seattle. Though the percentage of multi-generational households in Seattle is relatively low at 1.18%, 70.56% of the city’s multi-generational households live at or above the poverty level. Median housing costs are just 18.36% of the median income of multi-generational households. Seattle also boasts the seventh-lowest unemployment rate in our study.
Study Specifics
To find the best cities for multi-generational households our study considered five factors. First, we looked at the percentage of households in a city that are multi-generational. For this, we used the U.S. Census Bureau’s designation of households with grandparents living with their own minor grandchildren and not responsible for the grandchildren. This helped us eliminate households where grandchildren live with their grandparents without the middle generation present (this is also an important demographic trend but not a multi-generational household). Cities with a higher percentage of multi-generational households ranked higher in our study.
Second, we looked at the percentage of multi-generational households living at or above the poverty level. We wanted to eliminate households that were multi-generational but struggling. The point of this was to isolate the best cities for multi-generation households, not just the cities with the most multi-generational households. For this factor we used Census Bureau data on the number of multi-generational households (with the grandparent not responsible for their grandchildren) that had an income in the past 12 months at or above poverty level. We divided this number by the total number of multi-generational households. Cities with a higher percentage of multi-generational households at or above poverty level ranked higher in our study.
The third factor we looked at was the number of grandchildren living in multi-generational households. For this factor we used the Census Bureau’s data on the number of grandchildren under 18 years living with a grandparent where the grandparent is not responsible for the grandchildren. We included this factor because in the ideal city for multi-generational households, children who live in those households will have schoolmates in similar housing arrangements and won’t feel their multi-generational household isolates them socially.
The third and fourth factors we considered were economic. The fourth factor was the ratio of median housing costs to median income. For this we took each city’s median monthly housing costs and multiplied it by 12 to get median annual housing costs. We then took that number and divided it by the median income for multi-generational families to get the ratio of housing costs to income. We did this to eliminate cities where housing costs are so far out of reach of multi-generational households’ income that they have no choice but to co-habit.
The fifth factor we considered was the general unemployment rate in each city (not just for seniors) to give a sense of each city’s overall economic health. A lower unemployment rate helped a city rank higher in our study.
We gave each factor a weight of 1, except for housing costs as a portion of median income, which got double weight (to help eliminate multi-generational households formed entirely out of necessity). For each city that had data in all five factors we assigned a rank for each factor. We then averaged those ranks so each city had one average rank. The city with the highest average rank got a score of 100 and the city with the lowest average rank got a score of 0, with the cities in between spread evenly between 0 and 100.
Questions about our study? Contact blog@smartasset.com.
Photo credit: ©iStock.com/monkeybusinessimages