 Written by
The Environmental Protection Agency (EPA) says that renewable energy can increase power grid reliability, improve air quality and create more jobs. Additionally, renewable energy can lower fuel and electricity costs, reducing the total cost of homeownership. As Congress prepares to debate President Joe Biden’s sweeping $2 trillion American Jobs Plan, which focuses on building greener and tech savvier infrastructure, SmartAsset looked at data to rank the states that have been leading the charge on renewable energy.
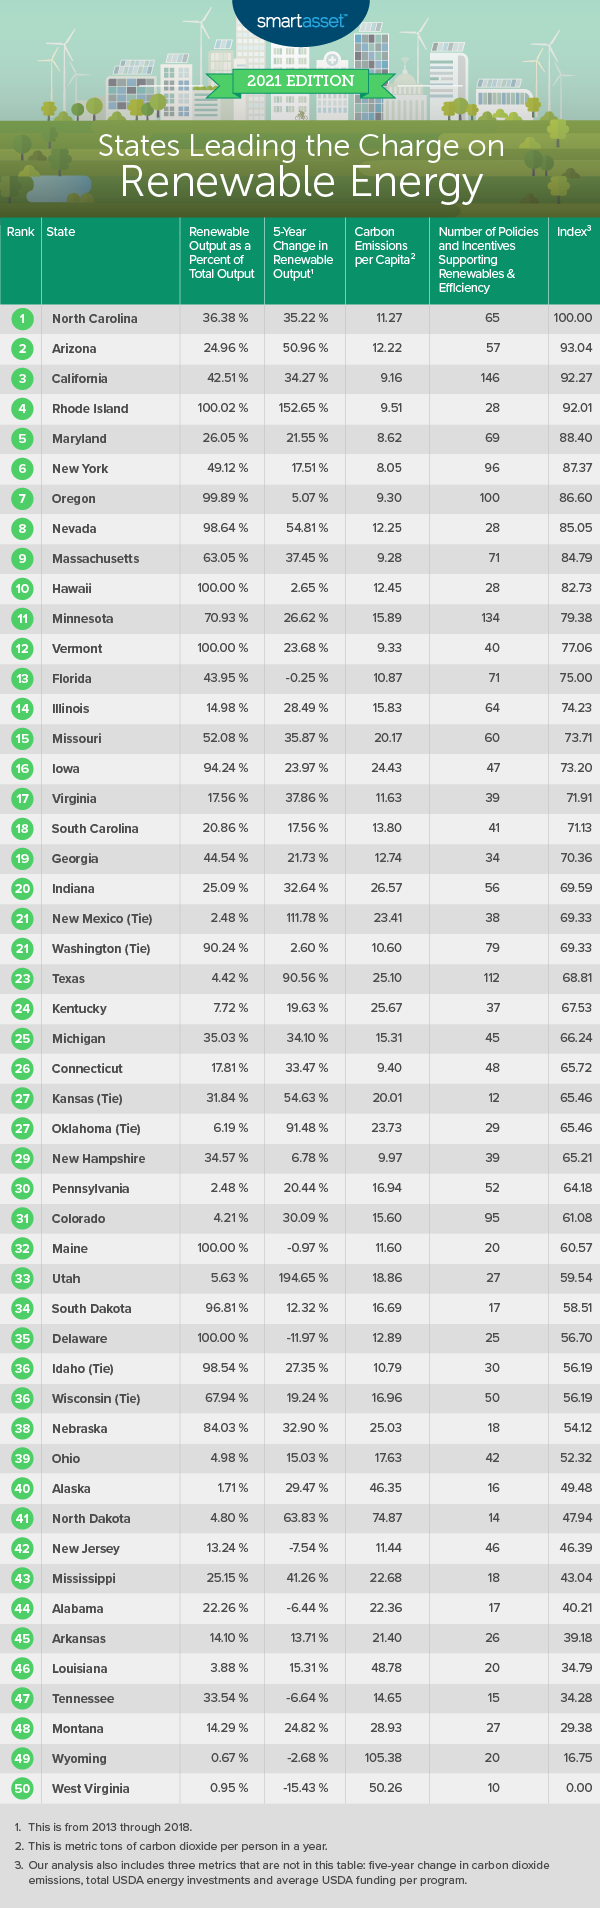
To do this, we consider various metrics, including: change in carbon dioxide emissions, carbon dioxide emissions per capita, change in renewable energy production, renewable energy as a percentage of total energy production, total amount of USDA assistance, average amount spent on energy programs and the total number of policies and incentives. For more details on how we found and analyzed our data, see the data and methodology section below.
This is SmartAsset’s second study on states leading the charge on renewable energy. You can read the 2019 study here.
Key Findings
- Southern states still rank at the bottom. Six out of the bottom 10 states in this study are located in the South, according to Census regional divisions. West Virginia, Tennessee, Louisiana, Arkansas, Alabama and Mississippi also placed in the bottom 10 in our 2019 study. On average, the five-year (2013-2018) change in renewable energy production increased by only 6.96%, compared to a study-wide average of almost 32%. Renewable energy as a percentage of total 2018 energy production in these states was less than 17%, compared to about 41% overall.
- Average carbon dioxide emissions dipped slightly. From 2012 to 2017, carbon dioxide emissions decreased by an average of 2.46% across all 50 states. The state leading the way on this is Kentucky, where emissions are down 16.95%. For a comparison, Idaho’s carbon dioxide emissions jumped up the most, increasing 18.48%.
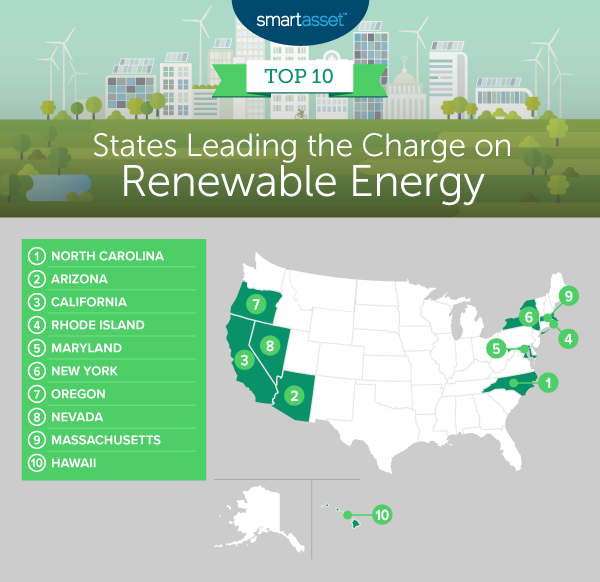
1. North Carolina
North Carolina leads the charge on renewable energy, with nearly $1.02 billion invested by the USDA in state programs. The state ranks first for this metric and has significantly more funding than Texas, which ranks second-highest for this metric (with $526,933,549 in funding). Furthermore, North Carolina ranks fourth for the average amount spent on each green energy program ($639,392) and 11th for the total number of policies and incentives geared towards renewable energy (65).
2. Arizona
Arizona finishes in the top half of this study for all metrics but one. The state ranks ninth for the five-year (2013-2018) change in renewable energy production (50.96%), 10th for the average amount of USDA funding spent per clean energy program ($401,844) and 14th for the total number of policies and incentives encouraging renewable energy development (57).
3. California
California leads the study for the number of renewable energy policies and incentives, which add up to 146. The Golden State ranks third-lowest for carbon emissions per capita, with 9.16 million metric tons of carbon dioxide per person, and finishes third-highest for total USDA assistance for clean energy projects, with more than $452 million.
4. Rhode Island
Rhode Island’s total energy production is 100.02% renewable, ranking first for this metric in our study. The state comes in second for its recent five-year change in renewable energy production – with an increase of 152.65% from 2013-2018 – and eighth for carbon dioxide emissions per capita – with 9.51 million metric tons per person.
5. Maryland
Maryland decreased carbon dioxide emissions by 14.40% over the recent five-year period from 2012-2017, which is the second biggest dip in this study. The Old Line State also ranks second for its relatively low carbon dioxide emissions per capita, with 8.62 million metric tons per person. Maryland ranks 10th for the number of renewable energy policies and incentives, which add up to 69.
6. New York
The Empire State produces 8.05 million metric tons of carbon dioxide per person, the fewest emissions in the study. New York ranks fifth for its high number of renewable energy policies and incentives, adding up to 96. But the state doesn’t fare as well when it comes to the five-year change in carbon dioxide emissions, reducing output by just 1.56% from 2012-2017 and ranking 31st for this metric overall.
7. Oregon
Oregon produces 9.30 million metric tons of carbon dioxide per person, the fifth-lowest rate on this list. Carbon dioxide emissions in the state, however, went up by 4.61% over the five-year period from 2012-2017, placing Oregon in the bottom 10 for this metric. However, the Beaver State still ranks sixth for renewable energy as a percentage of total energy production, at 99.89%.
8. Nevada
Carbon dioxide emissions have gone up 5.42% in Nevada recently (from 2012-2017), placing the state 44th out of 50 for that metric. However, the Silver State has the seventh-biggest five-year change in renewable energy production (54.81% from 2013-2018). Nevada also ranks seventh for the metric on renewable energy output, with 98.64% of all of its energy production being renewable.
9. Massachusetts
Massachusetts emits 9.28 million metric tons of carbon dioxide per person in the state, which is the fourth-lowest rate in our study. The Bay State also finishes in the top 10 for the total number of renewable energy policies and initiatives, with 71. But Massachusetts ranks in the bottom 10 of the study for its recent five-year carbon dioxide emissions figure, jumping 3.29% from 2012 to 2017.
10. Hawaii
The Aloha State’s total energy production is 100% renewable, the second-highest rate for this metric in the study. Although the state falls to 41st place for its 2013-2018 change in renewable energy output (with just a 2.65% increase), Hawaii ranks third in USDA assistance for clean energy projects, at $1,030,476.
Data and Methodology
To find the states leading the charge on renewable energy, SmartAsset looked at data for all 50 states. Specifically, we compared the states across the following seven metrics:
- Renewable output as a percentage of total energy production. This is renewable energy production divided by total energy produced in each state. Data is for 2018 and comes from the Energy Information Administration (EIA).
- Five-year change in renewable energy output. Data comes from the EIA and is for 2013 to 2018.
- Per-capita carbon emissions. Data comes from the EIA and is for 2017. Units are in metric tons of carbon dioxide per person.
- Five-year change in carbon emissions. Data comes from the EIA and is for 2012 to 2017. Units are million metric tons of carbon dioxide.
- Number of policies and incentives encouraging renewable energy development. This includes grants, loans, rebates and tax credits. Data comes from the Database of State Incentives for Renewables and Efficiency (DSIRE) and was pulled in January 2021.
- Total USDA energy investments. This is the total amount of funding received by the state from 2003 to 2019 from the U.S. Department of Agriculture (USDA) for renewable energy and energy efficiency projects and investments. Data was pulled in January 2021.
- Average USDA funding per program. This is the total USDA energy investment amount divided by the number of USDA-funded programs in the state. Data was pulled in January 2021.
To create our final score we ranked each state in each metric. Then we found each state’s average ranking, giving equal weighting to all metrics except total USDA energy investments and average USDA funding per program, which each received a half weight. We used this average ranking to create our final score. The state with the best average ranking received a score of 100. The state with the worst average ranking received a score of 0.
Home Buying Tips for Saving Both Energy and Money
- Recharge your finances too, with some professional support. If you want to buy a new home that relies on renewable energy, talk with someone to make sure you’re prepared financially. Finding the right financial advisor doesn’t have to be hard. SmartAsset’s free tool matches you with financial advisors in five minutes. If you’re ready to be matched with advisors may be able to help you achieve your financial goals, get started now.
- Manage your mortgage wisely. Make sure you know how much you’ll be paying each month before you move forward with any sales. SmartAsset’s mortgage calculator should give you an idea of how much you’ll owe each month.
- Don’t forget closing costs. Closing costs are an important but sometimes overlooked part of the cost of buying a house. Make sure you know what you might owe so you can factor that into your budget when you’re looking for a new place to live.
Questions about our study? Contact press@smartasset.com.
Photo credit: © iStock/kamisoka