 Written by
  With the cost of living generally high in major U.S. cities, the ability to keep larger expenses like housing costs to a minimum can sometimes make all the difference. In some cities, though, residents must spend a much larger chunk of change on rent or mortgage payments. Housing costs have also become increasingly burdensome due to the coronavirus crisis, which has impaired so many people’s ability to cover rent bills or mortgage payments, let alone sock away money into their savings.
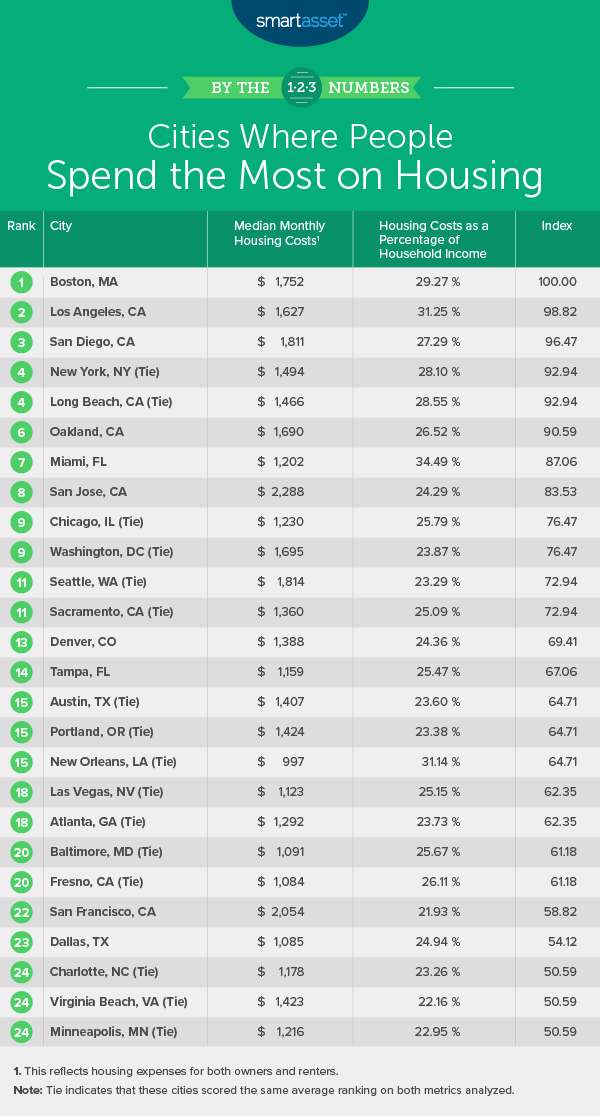
To find where people spend the most on housing, SmartAsset looked at data on the 50 largest U.S. cities across the following two metrics: median monthly housing costs and housing costs as a percentage of income. For details on our data sources and how we put all the information together to create our final rankings, check out the Data and Methodology section below.
Key Findings
- Monthly housing costs across the 50 largest U.S. cities span almost $1,592. Monthly housing costs across the 50 largest U.S. cities spans almost $1,600, from $696 in Detroit, Michigan to more than triple that amount – $2,288 – in San Jose, California.
- Three cities are officially housing cost-burdened. The average family (or household) in three cities — Miami, Florida; Los Angeles, California and New Orleans, Louisiana – is housing cost-burdened.
- A surprising result for San Francisco, California. California’s most populated Northern city, San Francisco, is widely known for its high housing costs. However, because incomes in San Francisco are also high, it ranks only 22nd on our list. The median monthly housing costs for renters and homeowners ($2,054) is the second-highest of any city, but that figure as a percentage of the median household income ($112,376) is only 21.93%, the ninth-lowest in our study.
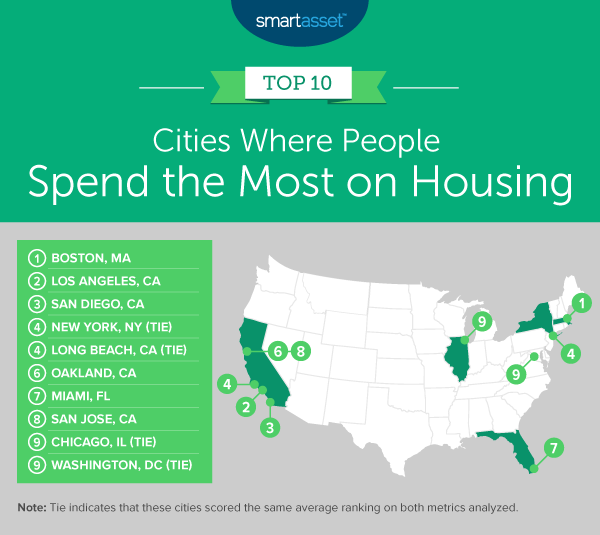
1. Boston, MA
On average, Boston, Massachusetts residents spend $1,752 per month on housing expenses, which represents 29.27% of their income. Boston ranks fifth- and fourth-highest for those two metrics, respectively.
2. Los Angeles, CA
Los Angeles is the first of five cities in California in the top 10 of this study. On average, Angelenos are housing cost-burdened, as their $1,627 in monthly housing costs (eighth-highest across all 50 cities) represents 31.25% of the average household income (second-highest overall).
3. San Diego, CA
The second California city in the top 10 is San Diego. San Diego has the fourth-highest median monthly housing expenses across all 50 cities for which we analyzed data, at $1,811. The city also finishes ranks within the top 10 for its high housing costs as a percentage of income, at 27.29%.
4. New York, NY (tie)
New York, New York ties for fourth place with Long Beach, California, and perhaps unsurprisingly, ranks within the top 10 cities for both metrics we considered. New York City has the ninth-highest median monthly housing costs in the study, at $1,494, and the sixth-highest housing costs as a percentage of income, at 28.10%.
4. Long Beach, CA (tie)
Long Beach, California ties with New York City for the No. 4 spot. Long Beach residents have a median monthly housing cost of $1,466, the tenth-highest total in our study. That amount represents 28.55% of the average income, which is the fifth-highest rate for this metric across the 50 cities we analyzed.
6. Oakland, CA
The next California location in this study is also the first of two in the Bay Area. In Oakland, California, residents must allocate an average of 26.52% of their income to pay housing costs, the 10th-highest rate for this metric in the study. Furthermore, the city has the seventh-highest median monthly housing costs in the study, with residents paying $1,690 on average.
7. Miami, FL
Miami, Florida has the highest rate in the study for housing costs as a percentage of income, at 34.49%. The median monthly housing costs in Miami amount to $1,202, the 19th-highest rate for this metric overall.
8. San Jose, CA
The fifth of five California city in the top 10 of this study is San Jose, where the median monthly housing costs total $2,288 – the highest rate for this metric across all 50 cities we looked at. That amount equals 24.29% of income, the 22nd-highest percentage for this metric overall.
9. Chicago, IL (tie)
Chicago, Illinois ties with Washington, D.C. for the No. 9 spot. The median monthly housing costs in the Windy City total $1,230, the 17th-highest amount for this metric in the study. Housing costs make up 25.79% of income, the 12th-highest rate for this metric overall.
9. Washington, D.C. (tie)
Tied for the No. 9 spot in our study with Chicago, Illinois is Washington, D.C. Housing costs in the nation’s capital make up 23.87% of income, which falls closer to the middle of the study, as 23rd-highest rate. However, these costs total $1,695 per month – the sixth-highest amount overall.
Data and Methodology
To find the cities where people spend the most on housing, we analyzed the 50 largest U.S. cities across two metrics:
- Median monthly housing costs. This is the median monthly housing costs for homeowners and renters. Data comes from the Census Bureau’s 2018 1-Year American Community Survey.
- Housing costs as a percentage of income. Data on median household income and median housing costs comes from the Census Bureau’s 2018 1-Year American Community Survey.
First, we ranked each city in each metric. We then found each city’s average ranking, assigning both metrics an equal weight. We used this average ranking to create our final score. The city with the highest average ranking received a score of 100. The city with the lowest average ranking received a score of 0.
Tips for Managing Your Housing Costs
- Coronavirus relief. If you’re burdened by the economic fallout of COVID-19 and need more information on programs such as mortgage relief, take a look at our guide here.
- Reassess your budget if possible. Making a budget is a great way to fit your housing costs and all other essential spending into your income. If you’re receiving a federal economic impact payment in light of the recent coronavirus crisis, it might be a good time to take another look at your budget. Use our free budget calculator to understand how best to allocate your income.
- Considering buying a home? Use SmartAsset’s calculator to see how much house you can afford.
- Find expert advice just for you. A professional advisor can help you how to best manage your housing costs while still doing what you need in order to achieve your other financial goals. Finding the right financial advisor that fits your needs doesn’t have to be hard. SmartAsset’s free tool matches you with financial advisors in your area in 5 minutes. If you’re ready to be matched with local advisors that will help you achieve your financial goals, get started now.
Questions about our study? Contact press@smartasset.com
Photo credit: ©iStock.com/Tinnakorn Jorruang