 Written by
Though definitions vary, economists and researchers generally characterize the middle class as households that earn approximately two-thirds to two times the median national income. Slightly more than half (52%) of American households are middle-class, according to the Pew Research Center, a decline from 61% in 1971. But the middle-class squeeze — featuring lowered living standards, a decline in real wages and the rising expense of consumer goods and housing — has has hobbled the cohort’s upward mobility. Still, some places in the U.S. are better suited than others to this socio-economic class.
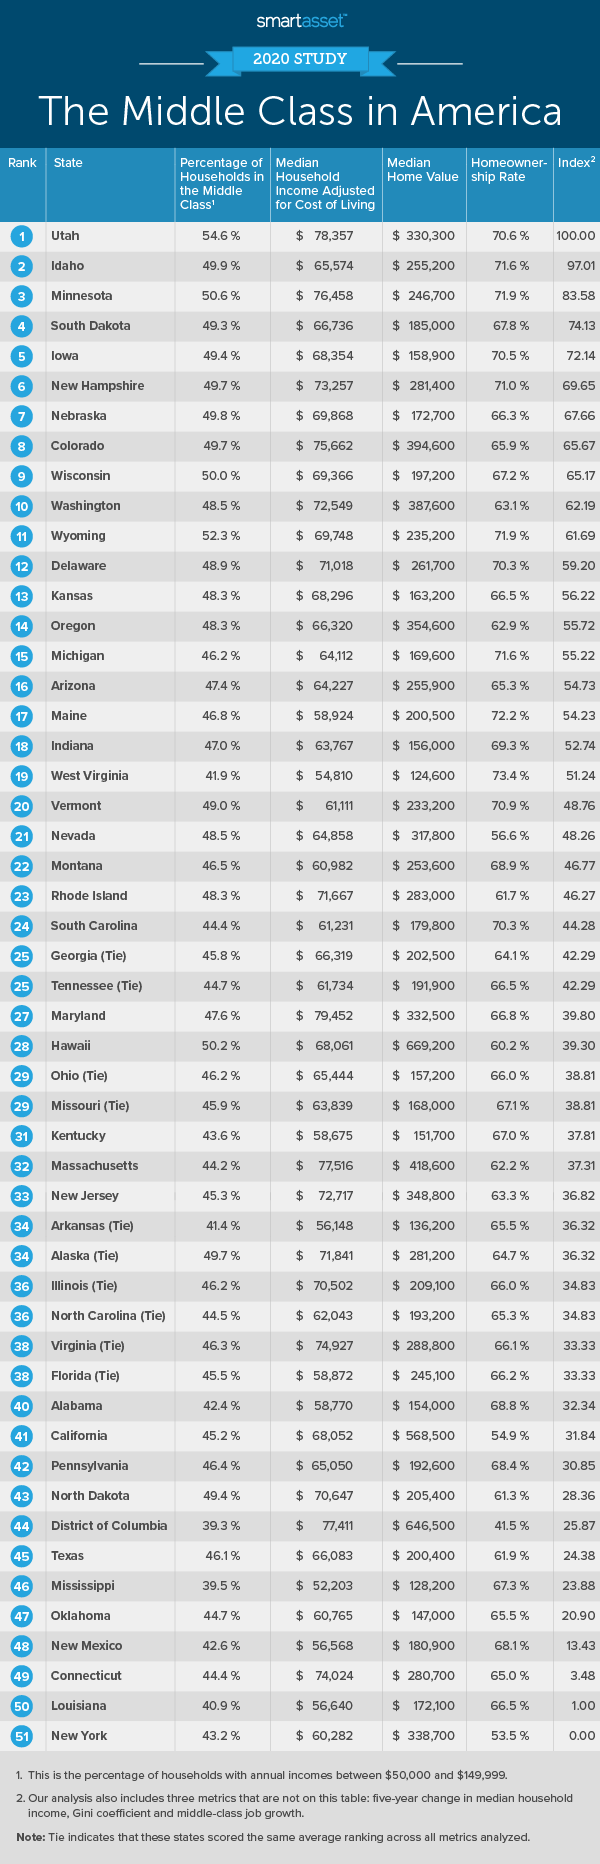
In this study, SmartAsset determined the best states for the middle class in 2020. We compared all 50 states and the District of Columbia across seven metrics. Specifically, we looked at the percentage of households in the middle class, median household income adjusted for cost of living, median home value, homeownership rate and Gini index. We also considered two four-year changes: median household income and middle-class job growth. For details on our data sources and how we put all the information together to create our final rankings, check out the Data and Methodology section below.
This is SmartAsset’s second annual study on the best states for the middle class in America. Check out last year’s version here.
Key Findings
- The Midwest dominates again. Last year, six of the top 10 states for the middle class were in the Midwest. This year, half of our top 10 states are in the same region: Minnesota, South Dakota, Iowa, Nebraska and Wisconsin. Indiana, which placed fifth last year, dropped to 18th this year.
- New Hampshire and Colorado move up. New Hampshire and Colorado ranked toward the middle of the pack last year. This year, both states improved across several metrics, ranking in the top 10. Most notably, the median household income adjusted for cost of living rose from about $70,600 to almost $73,300 in New Hampshire. In Colorado it increased by even more, from roughly $69,800 to almost $75,700.
1. Utah
Utah has the highest percentage of households in the middle class, as well as the lowest measured rate of income inequality. Census data from 2019 shows that 54.6% of households have annual incomes between $50,000 and $149,999 (which equals roughly two-thirds to two times the national median household income). Additionally, Utah’s Gini index – a measure of income inequality, where 0 indicates perfect equality and 1 indicates perfect inequality – is the lowest across all 50 states and the District of Columbia, at less than 0.43.
2. Idaho
Idaho ranks in the top fifth of states for five of the seven metrics in our study. It has the sixth-highest percentage of households in the middle class (49.9%), sixth-highest homeownership rate (71.6%), second-best Gini coefficient (just over 0.43) and second-highest four-year middle-class job growth (about 42%). From 2015 to 2019, the median household income in Idaho rose by roughly 26% – the most of any state – from about $48,300 to almost $61,000.
3. Minnesota
Like last year, Minnesota ranks particularly well for its high median household income adjusted for cost of living and its strong homeownership rate. Given that the cost of living in Minnesota is lower than the national average, we found that the median adjusted household income is almost $76,500 – the fifth-highest in the study. Additionally, almost 72% of Minnesotans own their homes or apartments, the highest rate for this metric in our top 10 and the third-highest rate overall.
4. South Dakota
South Dakota ranks fourth for two metrics: Gini index and four-year middle-class job growth. Census data from 2019 shows that incomes are more evenly distributed in South Dakota than they are nationally. The Gini index in the state is about 0.44, compared to the national coefficient of roughly 0.48. Additionally, between 2015 and 2019, the number of jobs with average earnings between $30,000 and $70,000 grew by more than 36%.
5. Iowa
Homes in Iowa are relatively affordable. The 2019 median home value was $158,900, ninth-lowest overall. Given lower values, many residents own their homes or apartments rather than renting. The 2019 Iowa homeownership rate is 70.5%, more than six percentage points higher than the national average and the 10th-highest across all 50 states and the District of Columbia.
6. New Hampshire
New Hampshire ranks in the top fifth of states for four metrics: percentage of middle-class households, homeownership rate, Gini index and median household income adjusted for cost of living. Almost five in 10 New Hampshire households earn between $50,000 and $149,999 and about seven in 10 of them own their home. The most recently reported Gini index in New Hampshire is about 0.44, and the median household income adjusted for cost of living in the state is almost $73,300.
7. Nebraska
Nebraska ranks in the top 15 states for three of the seven metrics in our study. It has the seventh-highest percentage of households in the middle class (49.8%), eighth-best Gini index (0.44) and 14th-lowest median home value ($172,700). Given relatively low home values, Nebraskan residents may become homeowners faster on average. In a recent study, we found that the estimated time to homeownership in Nebraska’s largest city, Omaha, is shorter than three years.
8. Colorado
Colorado ranks as the No. 8 state for the middle class in 2020. Though the median home value in Colorado is high – at $394,600 – incomes are high relative to the overall cost of living. The median household income adjusted for cost of living in Colorado is almost $75,700, the sixth-highest in our study. Additionally, between 2015 and 2019, the median household income rose by almost 21%, the third-highest increase in our top 10 and the 10th-highest overall.
9. Wisconsin
About half of the households in Wisconsin earn between $50,000 and $149,999 annually – the fifth-highest percentage in our study. Additionally, Wisconsin ranks well for its relatively low Gini index and relatively high median household income adjusted for cost of living. Census data from 2019 shows that the Gini index in Wisconsin is less than 0.44, the third-best in our top 10 and sixth-best overall. We also found that as the cost of living is about 8% lower than the national average, the median household income adjusted for living costs is more than $69,300.
10. Washington
Washington rounds out our list of the top 10 states for the middle class. With incomes rising in the state, Washington has the 11th-highest median household income adjusted for cost of living. Between 2015 and 2019, the state’s median household income rose by almost 23%, the second-highest rate for this metric in the top 10 and the fourth-highest overall. As a result, the median Washington household income adjusted for cost of living is about $72,500.
Data and Methodology
To find the best states for the middle class, we looked at data for all 50 states and the District of Columbia. We compared states across seven metrics:
- Percentage of households in the middle class. This is the percentage of households with an annual income between $50,000 and $149,999, which equals approximately two-thirds to two times the median national income. Data comes from the U.S. Census Bureau’s 2019 1-year American Community Survey.
- Median household income adjusted for cost of living. Household income figures come from the U.S. Census Bureau’s 2019 1-year American Community Survey and cost of living data is from the U.S. Bureau of Economic Analysis.
- Four-year change in median household incomes. This is the percentage change in median household incomes from 2015 to 2019. Data comes from the U.S. Census Bureau’s 2015 and 2019 1-year American Community Surveys.
- Median home value. Data comes from the U.S. Census Bureau’s 2019 1-year American Community Survey.
- Homeownership rate. This is the number of owner-occupied housing units divided by total occupied housing units. Data comes from the U.S. Census Bureau’s 2019 1-year American Community Survey.
- Gini index. This is a statistical measure of income inequality. An index of 0 indicates perfect equality, and an index of 1 indicates perfect inequality. Data comes from the U.S. Census Bureau’s 2019 1-year American Community Survey.
- Four-year middle-class job growth. This is the increase in employment for jobs with average earnings between $30,000 and $70,000. Data comes from the Bureau of Labor Statistics and is for 2015 and 2019.
We ranked each state in every metric, giving a full weighting to each. We then found each state’s average ranking and used this average to determine a final score. The state with the highest average ranking received a score of 100, while the one with the lowest average ranking received a score of 0.
Middle Class and Ready to Put Down Roots?
- Buy or rent? Before starting to look for a home, make sure it makes sense. If you’re middle class and considering the places best suited to you and your family, consider how long you’d like to stay. If you’re planning to stay for the long haul, buying may be the best option. However, if your stop in a new home will be a short one, you will likely want to rent. SmartAsset’s rent or buy calculator can help you see the cost differential between purchasing a home relative to renting. And if you decide buying is for you, make sure you know how much house you can afford.
- Mortgage management. If you’re middle class and looking to manage your budget when purchasing a home, it is important to know what you’ll be paying each month and for how long. To get a sense of what that might look like, check out SmartAsset’s free mortgage calculator.
- Seek out trusted advice. Whether or not you’re based in a state favorable to middle-class living, having expert financial advice can be the key to upward mobility. Finding the right advisor doesn’t have to be hard. SmartAsset’s free tool matches you with financial advisors in your area in five minutes. If you’re ready to be matched with local advisors that will help you achieve your financial goals, get started now.
Questions about our study? Contact us at press@smartasset.com
Photo credit: ©iStock.com/peeterv