 Written by
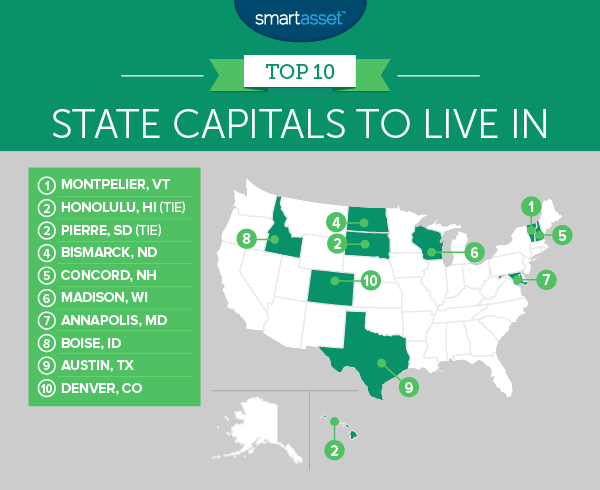
Capital cities can be the best places to live in their states. They tend to have low unemployment rates, are the focal point for political activity for the state and are sometimes even affordable. But which state capital is the best? Below SmartAsset crunches the numbers on the relevant livability metrics to find the best capital cities to live in.
Buying a home in your state capital? Check out mortgage rates.
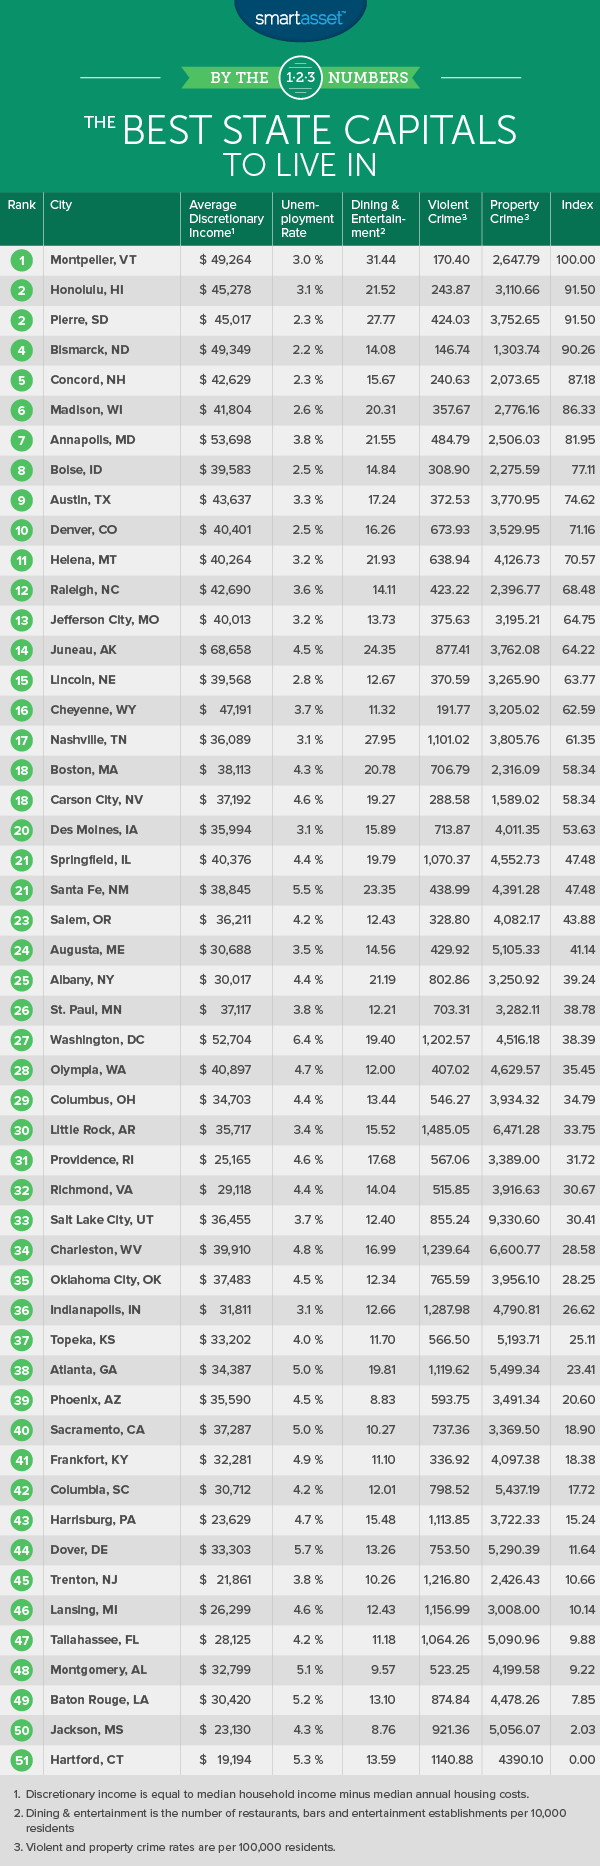
In order to rank the best state capitals, we compared them across five livability factors. We looked at average disposable income, unemployment rate, the rate of dining and entertainment establishments and property and violent crime rates.
Key Findings
- Similar story – Many of the top 10 from last year’s study continued to dominate. In fact eight of last year’s top 10 were repeats in this year’s top 10. The two newcomers were Boise, Idaho and Denver, Colorado, which replaced Juneau, Alaska and Helena, Montana.
- Southern capitals – Capitals in the South tend to be the least livable. They suffer from high unemployment rates and high crime rates. For example, Tallahassee, Florida; Montgomery, Alabama; Baton Rouge, Louisiana and Jackson, Mississippi are four of the five least livable state capitals.
This is SmartAsset’s fourth annual study of the best state capitals. Check out the 2016 version here.
1. Montpelier, Vermont
Montpelier is the best state capital to live in for the third straight year. This city scored well in just about every metric we analyzed, scoring in the top 10 in all metrics. The Vermont capital is safe. It had the ninth-lowest property crime rate and second-lowest violent crime rate in the study.
Plus, if you’re looking for fun, Montpelier is a good place to be. This city has the highest rate of entertainment and eating establishments per 10,000 residents.
2. (tie) Honolulu, Hawaii
Honolulu is one of the most idyllic capitals in the country. Of course, living in paradise comes at a price. The median monthly housing cost here is over $1,300 per month. Those costs spill over into just about everything else in Honolulu, meaning you will need to be earning quite a bit to be comfortable there. Fortunately, the median household here makes over $60,000 per year, leaving them with about $45,000 after housing costs.
There are other costs to living in Hawaii, leaving the island for the mainland can mean paying a ton in travel costs. You could use a travel rewards credit card to mitigate some of those costs.
2. (tie) Pierre, South Dakota
Pierre has one of the strongest economies in the country shown by its low unemployment rate of 2.3%. Compared to other capital cities across the nation that ranks second.
Working in Pierre also leaves residents with a decent amount of change left over after paying for housing. The average household here has around $45,000 left after paying for housing.
4. Bismarck, North Dakota
Pierre’s capital neighbor to the north, Bismarck, takes fourth. Like Pierre, business in Bismarck is booming. The unemployment rate here is only 2.2%, the lowest in the study. Plus, the average household has an income just shy of $59,000 per year.
Thanks to the affordable housing and low mortgage rates, the average house costs about $800 per month. One thing to keep in mind is that property taxes in North Dakota are on the high side. Bismarck also has the lowest crime rates in our study.
5. Concord, New Hampshire
The second New England capital in the top 10 is Concord. Concord is tied for second-lowest unemployment rate in the study at 2.3%.
This is also a very safe capital, relative to the others we analyzed. Concord has a property crime rate of 2,073 per 100,000 residents and a violent crime rate of 240 per 100,000 residents. It ranks third and fourth for those metrics, respectively.
6. Madison, Wisconsin
Mad City once again takes sixth. The unemployment rate dropped significantly from 3.3% last year to 2.6% this year. Another reason why Madison is so livable, other than the access to opportunities, is the availability of fun things to do. This city has the 11th-highest rate of entertainment and dining establishments per 10,000 residents.
Don’t sleep on Madison! We previously found the city was one of the best college towns to live in and one of the most livable cities in America.
7. Annapolis, Maryland
If you’re looking to have a lot of money left over after paying for housing, Annapolis could be the place for you. The average household here has about $53,698 in income, after paying the average housing costs.
Watch out though, that $53,000 may not go as far as it does in other cities. For example, according to our cost of living calculator, Annapolis is about 28% more expensive than Pierre.
8. Boise, Idaho
Living in Boise is great, according to our data. This city has the fourth-lowest unemployment rate in our study and the fourth-lowest property crime rate.
However, despite the abundant opportunities, living in Boise will not leave you with a ton of income left after paying for housing. We estimate that the average Boise household should have just under $40,000 to spend after paying housing costs.
9. Austin, Texas
Relative to some other capital cities Austin has a high unemployment rate. Around 3.3% of residents around Austin cannot find work at the moment, the worst rate in our top 10.
But high incomes and abundant fun establishments may make up for that. Austin has the ninth-highest income after housing costs at $43,000 on average, and 17.24 dining and entertainment establishments per 10,000 residents, the 17th-highest in the study.
10. Denver, Colorado
Our list ends in the Centennial state. Denver offers plenty of jobs. This city has an unemployment rate of only 2.5%, fourth-best in our study.
Denver also scored in the top half in every metric we analyzed, except violent crime rate where it ranked 27th.
Data and Methodology
In order to find the best capital cities to live in, we analyzed data for every state capital in the U.S., plus Washington D.C. We compared them across the following five categories:
- Disposable income. This is the different between median household income and median housing costs. Data comes from the Census Bureau’s 2015 5-Year American Community Survey.
- Unemployment rate. Data comes from the Bureau of Labor Statistics and is for June 2017.
- Dining and entertainment establishments per 10,000 residents. This is the number of bars, restaurants and entertainment establishments per 10,000 residents. Data comes from the Census Bureau’s 2015 County Business Patterns Survey.
- Violent crime rate per 100,000 residents. Data comes from the FBI’s Uniform Crime Reporting Database for 2015. Harrisburg, Pennsylvania data comes from 2014 due to lack of 2015 data. Crime data for Raleigh, North Carolina comes from the North Carolina State Bureau of Crime Investigation’s Revised Annual Summary Report of 2015 Uniform Crime Reporting Data.
- Property crime rate per 100,000 residents. Data comes from the FBI’s Uniform Crime Reporting Database for 2015. Harrisburg, Pennsylvania data comes from 2014 due to lack of 2015 data. Crime data for Raleigh, North Carolina comes from the North Carolina State Bureau of Crime Investigation’s Revised Annual Summary Report of 2015 Uniform Crime Reporting Data.
We ranked each city in each metric. After, we found each city’s average ranking. We gave each metric an equal weighting, except violent crime which we gave a weighting of 0.7 and property crime rate which we gave a weighting of 0.3. Then we used each city’s average ranking to create our final score. The city with the best average ranking received a score of 100. The city with the worst average score received a score of 0.
Tips for Balancing Affordability and Livability
A few of the most livable capital cities are also pricey. It can be difficult at times to balance living the good life and still managing to save money.
With any financial balancing act, it is a good idea to keep an accurate budget. This way you know exactly where your money is going and how much you have to work with. According to the 50/30/20 budget, you should be spending 50% of your income on housing, 30% on fun and 20% on saving. The most important part of that budget however is saving. That saving is what you use to pay for a down payment or a comfortable life during retirement.
If you find yourself spending too much on housing, there are a few things you can do. For example, check how much you are using your electricity or hot water. While utilities are not the bulk of housing costs, any saving can help. Roommates are another great way to save, especially in the least affordable cities.
If you are the type who loves to eat out or spends too much on groceries, the right rewards credit card can help you save big. Some of the best rewards credit cards come with 5% cash back on groceries or double points on eating out. By optimizing your spending to the right credit card you can save hundreds of dollars.
Data analysis for this study was done by Nick Wallace.
Questions about our study? Contact us at press@smartasset.com.
Photo credit: ©iStock.com/DenisTangneyJr