 Written by
Overseen by the Small Business Administration (SBA), the Paycheck Protection Program (PPP) is the largest fixture of federal coronavirus financial relief programs. The program provides forgivable loans to small businesses, defined as those with fewer than 500 employees, to cover payroll and associated costs.
There have been two rounds of funding through the program. An initial $349 billion was allocated to the program under the CARES Act, passed on March 27, 2020, and applications were first accepted starting April 3. After that funding was quickly exhausted, an additional $310 billion was apportioned to the program on April 24. The SBA began accepting applications for the second round of funding starting April 27.
In this study, SmartAsset looked at how PPP loan acceptance rates have changed over time in the 50 largest U.S. metro areas. We used data from the Census Bureau’s new Small Business Pulse Survey, which first surveyed small businesses for the week spanning April 26 to May 2, 2020. We compared business responses in the first week of the survey to those from the last week of May. It is important to note that because the survey is experimental, sampling errors tend to be high relative to other Census-reported data. For details on our data sources and how we put all the information together, check out the Data and Methodology section below.
Key Findings
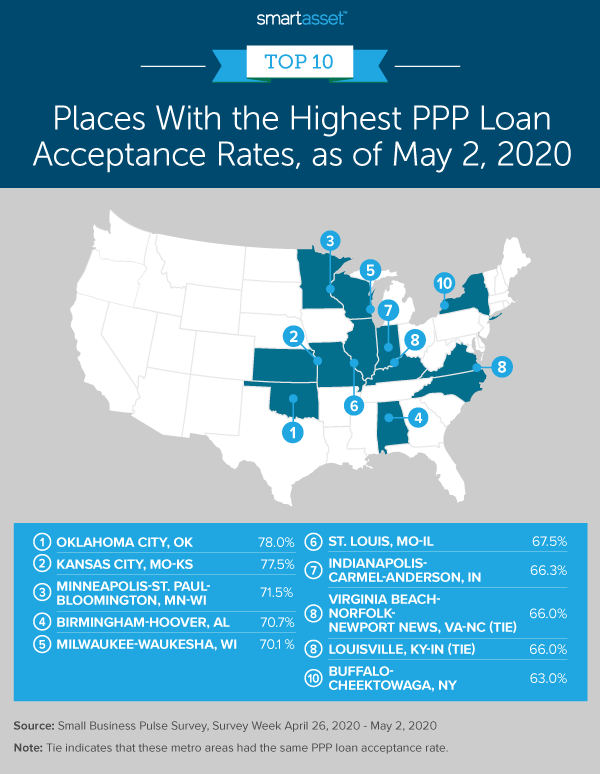
- Midwestern metro areas had the highest PPP loan acceptance rates in the first round. Of the top 10 metro areas with the highest PPP loan acceptance rates, according to survey responses from April 26 through May 2, 2020, five are in the Midwest. Kansas City, Missouri-Kansas leads the pack with an acceptance rate of approximately 78%.
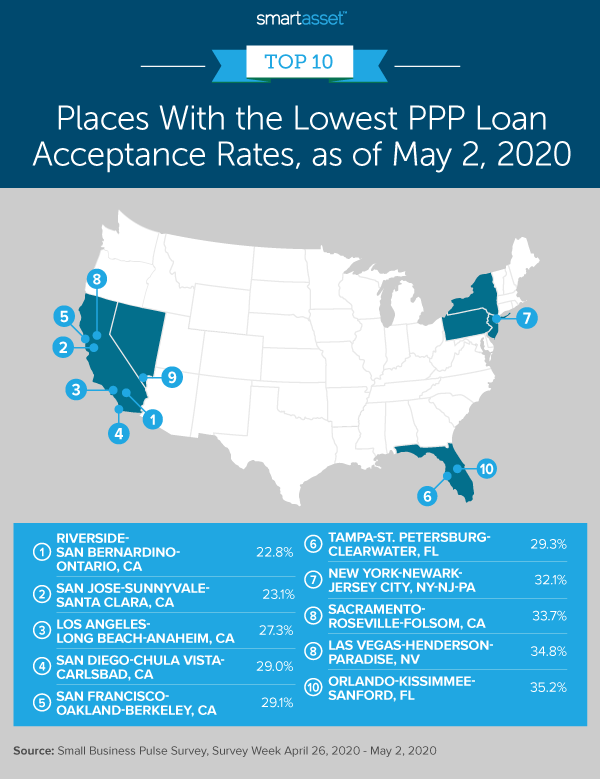
- California metro areas were the least lucky in the first round of funding. The five metro areas with the lowest initial PPP loan acceptance rates are all in California. Of the small businesses in these metro areas that had applied for a PPP loan, fewer than three in 10 reported that they had received one in the first week of the Census Bureau’s Business Pulse Survey collection.
- PPP loan funding is catching up to demand in the second round. In 27 of the 50 metro areas we considered, less than half of the submitted applications were accepted following the first round of funding, primarily on a first come, first served basis. By contrast, although the second round of funding is ongoing, more than four in five loan applications have now been accepted in all of the 50 largest metro areas.
The First Round of Funding: A Mad Rush and Uneven Acceptances Rates
The initial $349 billion in PPP funding was exhausted in just two weeks. With the rush to apply for the PPP loans, the percentage of businesses that applied for a loan and the percentage of businesses that received a loan varied widely by place.
According to data from the first week of the Small Business Pulse Survey, Milwaukee-Waukesha, Wisconsin had the highest rate of small businesses reporting that they had applied for a PPP loan by May 2, 2020, at about 84%. By contrast, only about two-thirds of small businesses in Kansas City, Missouri-Kansas had applied by that same date.
Figures vary even more widely when considering the percentage of businesses that had received a loan. As of May 2, 2020, more than 64% of all small businesses in Oklahoma City, Oklahoma reported receiving a PPP loan compared to less than 17% in San Jose-Sunnyvale-Santa Clara, California.
Using the percentage of businesses that applied for a PPP loan and the percentage of businesses that received a loan, we calculated the PPP loan acceptance rates in each metro area. Oklahoma City, Oklahoma had the highest acceptance rate based on survey data for the week April 26 through May 2, 2020. About 78% of businesses that applied received the loan.
Kansas City, Missouri-Kansas follows closely behind Oklahoma City, with an acceptance rate of 77.5%. Based on survey data for the week April 26 through May 2, 2020, about 66% of small businesses in Kansas City had applied for the PPP and about 51% had received financial assistance from the program. The map below shows the metro areas with the top 10 PPP loan acceptance rates following the first round of funding and one week through the second round.
Some places were less lucky in the first round of funding. Riverside-San Bernardino-Ontario, California had the lowest acceptance rate, at 22.8%. About 77% of small businesses in the metro area applied for a loan, but less than 18% of them received a loan during that round.
New York-Newark-Jersey City and Las Vegas-Henderson-Paradise also rank in the 10 metro areas with the lowest PPP loan acceptance rates during the first round. These places have seen high infection and unemployment rates due to the COVID-19 crisis. The New York City metro area has been an epicenter of the pandemic since the beginning of March. Meanwhile, with many industries in the Las Vegas metro area reliant on tourism, unemployment in the area rose by the third-highest rate of any metro area between February and April 2020, as we found in our recent study. The map below shows the full list of places with the lowest PPP loan acceptance rates following the first round of funding and one week through the second round.
The Second Round of Funding: Flattening Demand and Converging Acceptance Rates
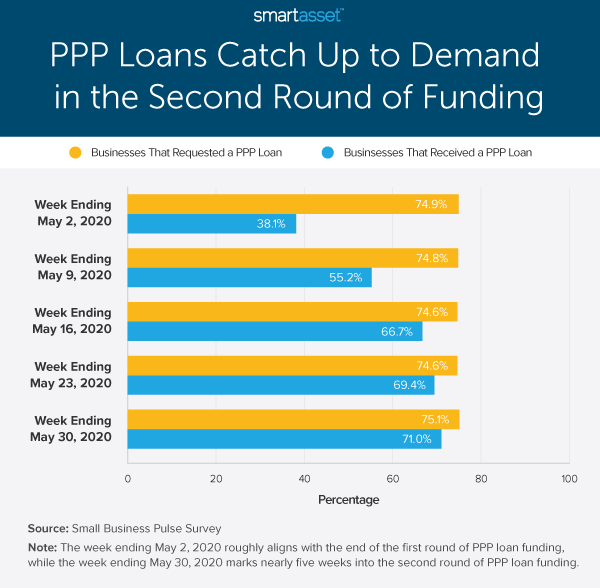
The second round of PPP loan funding has been open for about six weeks, and according to May 30, 2020 data from the Small Business Administration, roughly $150 billion remains to be given out. Throughout the second round of funding thus far, the percentage of businesses receiving loans has caught up to the percentage of businesses requesting assistance. The bar graph below shows nationally how more and more PPP applicants have reported that they have received assistance.
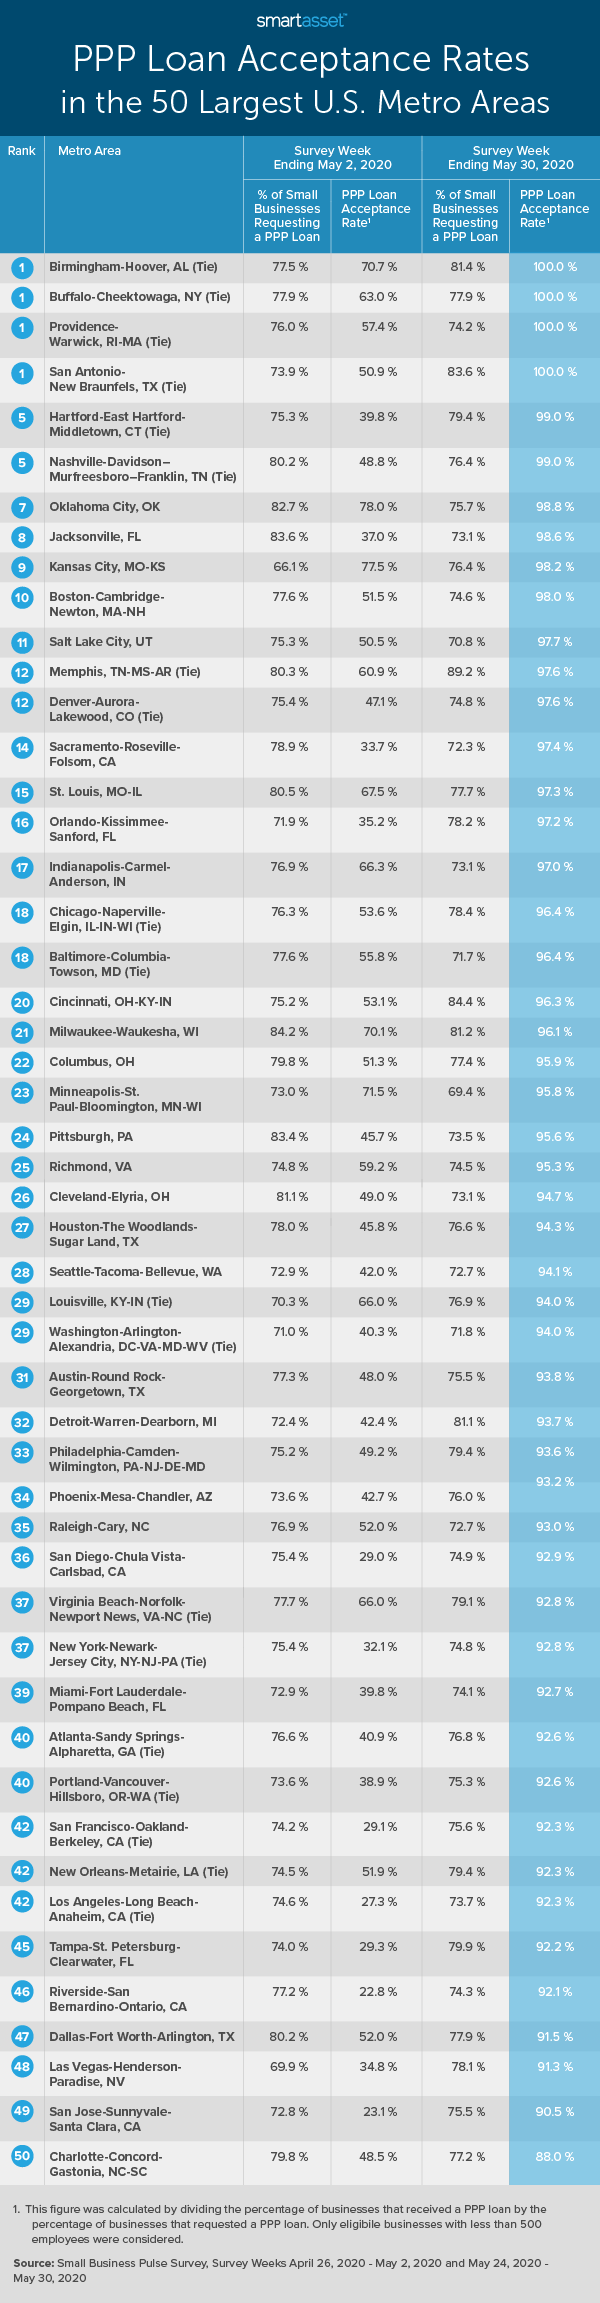
With converging percentages of businesses that applied for a PPP loan and businesses that received the loan nationally, acceptance rates across metro areas have also evened out. For the survey week May 24 through May 30, 2020, the range of reported acceptance rates across all 50 metro areas was 12% – ranging from approximately 88% to about 100% – compared to a difference of more than 55% for the survey week April 26 through May 2, 2020.
Census Bureau data through the end of May shows that all requested PPP loan applications in four metro areas have been accepted: Birmingham-Hoover, Alabama; Buffalo-Cheektowaga, New York; Providence-Warwick, Rhode Island-Massachusetts and San Antonio-New Braunfels, Texas. Around 80% of small businesses applied in all those areas. San Antonio-New Braunfels, Texas had the highest percentage of small business apply and receive the loan, at 83.6%, while Providence-Warwick, Rhode Island-Massachusetts had the smallest, at 74.2%.
For the survey week May 24 through May 30, 2020, only one metro area reported a PPP loan acceptance rate of less than 90% – Charlotte-Concord-Gastonia, North Carolina-South Carolina. About 77% of small businesses in the area applied for a loan and less than 68% of them received funding. As a result, the Charlotte-Concord-Gastonia acceptance rate for that week was about 88%. The information table below shows data across all 50 metro areas, ranked by acceptance rates in the second round of funding.
Data and Methodology
All data for this study comes from the Census Bureau’s Small Business Pulse Survey. The survey is experimental and aims to capture changes in business conditions for small businesses during the coronavirus pandemic. The first week of survey results was published on May 14, 2020 for the week April 26, 2020 through May 2, 2020. Since then, new responses have been published weekly.
To calculate PPP loan acceptance rates, we divided the percentage of businesses that received a PPP loan by the percentage of businesses that applied for a loan. Data for the first section in this study, “The First Round of Funding: A Mad Rush and Uneven Acceptance Rates,” comes from the first published survey week (April 26, 2020 – May 2, 2020). Data for the second section, “The Second Round of Funding: Flattening Demand and Converging Acceptance Rates,” comes from the last survey week in May (May 24, 2020 – May 30, 2020).
As previously noted, because the Small Business Pulse Survey is an experimental data product, sampling errors tend to be higher relative to other Census-produced data products. For more information on the Census Bureau’s methodology when designing the survey and collecting responses, please see its website here.
Tips for Business Owners During the Coronavirus Pandemic
- Consider other SBA loans. If your PPP loan application wasn’t accepted or you don’t think money from the program will work for your business needs, another popular loan program that has been allocated additional funding by the federal government during COVID-19 is Economic Injury Disaster Loans (EIDLs). The SBA has numerous other business relief programs available at the municipal, state and federal levels. Check out our full guide here.
- Find support from other sources. Several other establishments are providing relief to individuals and businesses who have sustained financial loss because of coronavirus. See our full list of companies helping coronavirus-impacted people.
- Seek expert advice. If you are a business owner or a worker who is struggling with money in the light of the ongoing crisis, consider working with a financial advisor to help you make the most of your finances and help you during this crisis. Finding the right financial advisor who fits your needs doesn’t have to be hard. SmartAsset’s free tool matches you with financial advisors in your area in five minutes. If you’re ready to be matched with local advisors that will help you achieve your financial goals, get started now.
Questions about our study? Contact us at press@smartasset.com
Photo credit: ©iStock.com/Kameleon007