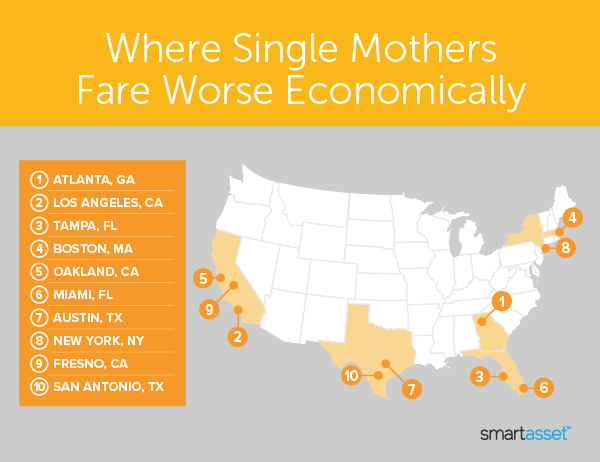
As of 2020, there are 10.7 million single parent households in the U.S. and 80.5% of them are headed by single mothers. Single mothers have also seen a decrease in their income over the past several years and nearly half of them (47.5%) are living in poverty. In some cities, single mothers tend to face more economic hardship when working to meet the extra demands of parenting without spousal support.
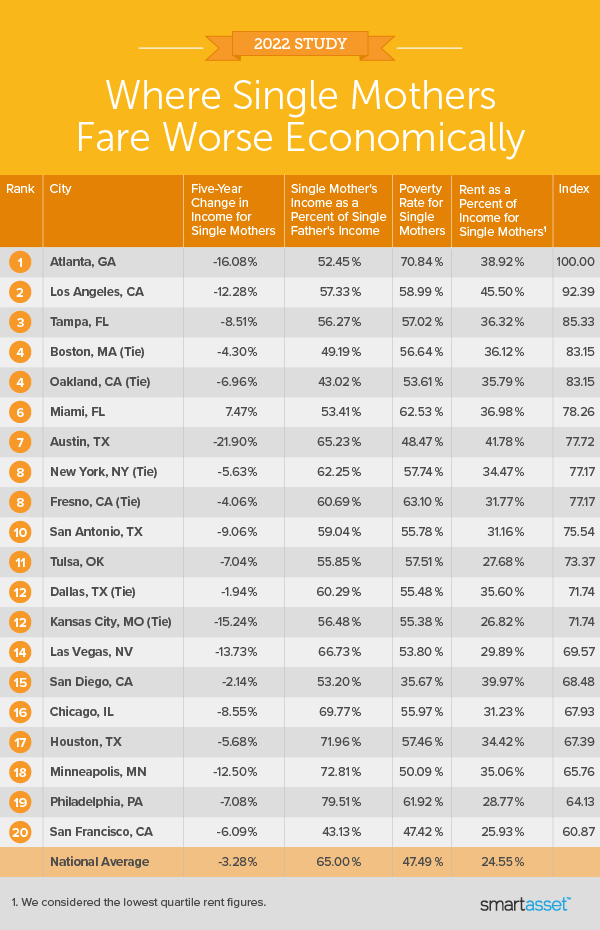
In this study, SmartAsset analyzed the 50 most populous U.S. cities across four metrics to find where single mothers struggle the most financially. These metrics include the five-year change in income for single mothers, single mother’s income as a percentage of single father’s income in the same city, poverty rate for single mothers, and rent as a percentage of income for single mothers. For more information on our data or how we put together our findings, read our Data and Methodology section below.
Key Findings
- In half the cities we analyzed, the median household income for single mothers decreased from 2014 to 2019. The city with the largest percentage decrease is Austin, Texas (-21.9%). Comparatively, Seattle, Washington has the largest percentage increase (69.4%), with median income for single mothers rising from $41,134 to $69,663.
- The percentage of single mothers living below the poverty line ranges from 22.8% to 70.8%. San Jose, California has the lowest percentage and has a population that is two times larger than the city with the highest percentage of single mothers living below the poverty line: Atlanta, Georgia.
- Single mothers earn more than $40,000 in just seven of the 50 cities we analyzed. Those cities are San Jose, California ($57,395); San Francisco, California ($48,785); Seattle, Washington ($69,663); Washington, D.C. ($43,126); Portland, Oregon ($40,960); Raleigh, North Carolina ($40,080) and Virginia Beach, Virginia ($55,389).
- Single mothers outearn single fathers in just four cities. Single mothers in Virginia Beach, Virginia earn the most relative to single fathers (nearly 12% more). The three other cities where the median income for single mothers is higher than the median income for single fathers are New Orleans, Louisiana; Nashville, Tennessee and Detroit, Michigan. Nationally, single mothers typically earn 65% of what single fathers do.

1. Atlanta, GA
This popular Southern city not only ranks as the worst place for single mothers economically, but it also ranks in the bottom 10% of cities for all four metrics we analyzed. Atlanta, Georgia is the only city in this study to do so. Roughly 71% of single mothers in this city earn an income below the poverty line and single mothers earn just 52% of a single father’s income. Single mothers in the city can also expect to pay 38.9% of their income in rent annually (ranking fourth-highest). From 2014 to 2019, there has been a 16.1% decrease in median household income for single mothers in Atlanta.
2. Los Angeles, CA
In Los Angeles, California, single mothers spend 45.5% of their income on rent annually (which ranks worst for this metric). The 2019 median household income for single mothers in this city is $27,006, or 12.3% lower than in 2014. Also, 59.0% of single mothers live below the poverty line.
3. Tampa, FL
In Tampa, Florida, the 2019 median household income for single mothers is $25,703, which is 8.5% lower than in 2014. Tampa also ranks sixth-worst for rent as a percentage of median household income for single mothers (36.3%) and eighth-worst for the percentage of single mothers below the poverty line (57.0%).
4. Boston, MA
Single mothers in Boston, Massachusetts pay an average of 36.1% of their income for rent annually, ranking seventh-worst in our study for this metric. The median household income for single mothers is $30,436. Compared to single fathers in the same city, single mothers earn less than half (ranking fourth-worst).
5. Oakland, CA
Across the four metrics we studied, Oakland, California ranks the worst when comparing median household income between single mothers and single fathers. Single mothers earn $31,250, which is just 49% of what single fathers bring home. Over the past years, single mothers have experienced a 6.7% decrease in their income (ranking 13th-worst) and 53.6% of them earned an income below the poverty line (ranking 21st-worst). For basic living, 35.8% of that income will go to rent annually (ranking eighth-worst).
6. Miami, FL
Miami, Florida ranks fifth-worst for both the percentage of single mothers with an income below the poverty line (62.5%) and rent as a percentage of median household income (37.0%). The median household income for single mothers is $27,419 and when comparing that to what single fathers earn in the same city, single mothers earn just 53% of what single fathers do (ranking seventh-worst).
7. Austin, TX
With the worst five-year decrease in median household income for single mothers (-21.9%), Austin, Texas also ranks second-worst for rent as a percentage of income (41.8%). The median household income for single mothers in this city is $27,256, which is about 65% of what single fathers earn. When looking at the poverty rate for single mothers, Austin has the lowest percentage among the 10 worst-ranking cities (48.5%).
8. New York, NY
The Big Apple proves to offer a less than positive economic environment for single mothers. The median household income for the aforementioned demographic is $31,858, which has decreased 5.6% since 2014 (ranking 16th-worst). Compared to the earnings of single fathers, single mothers make just 62% of what single fathers do in New York city (ranking 17th-worst). Also, 57.7% of single mothers have an income that is below the poverty line (ranking ninth-worst).
9. Fresno, CA
This city has the lowest five-year percentage decrease in median household income (-4.1%) in the bottom 10 cities, which ranks 18th-worst overall in our study. Despite this, Fresno, California ranks fourth-worst for the percentage of single mothers with an income below the poverty line (63.1%). Single mothers in this city can expect to spend 31.8% of their income on rent annually.
10. San Antonio, TX
San Antonio, Texas ranks eighth-worst for the five-year percentage change in median household income for single mothers, at -9.1%, bringing the median household income to $26,570. Compared to the earnings of single fathers in the same city, single mothers earn 59% of what single fathers do (ranking 13th-worst). Also, 55.8% of single mothers earned an income below the poverty line, which ranks 17th-worst for that metric. Additionally, single mothers can expect to pay 31.2% of the income towards rent annually.

Data and Methodology
To find the cities where single mothers fare worse economically, SmartAsset looked at data for the 50 most populous cities. We compared them across four metrics:
- Five-year change in median income for single mothers. Data comes from the Census Bureau’s 1-year 2014 and 2019 American Community Surveys.
- Median income for single mothers as a percentage of median income for single fathers. This is the percentage of income earned by single mothers compared to the income of single fathers in the same city. Data comes from the Census Bureau’s 1-year 2019 American Community Survey.
- Poverty rate for single mothers. Data comes from the Census Bureau’s 1-year 2019 American Community Survey.
- Rent as a percentage of median income for single mothers. Rent figures used represent the lowest quartile. Data comes from the Census Bureau’s 1-year 2019 American Community Survey.
We ranked each city in every metric, giving a full weight to all metrics. Using those rankings, we found each city’s average ranking and used the average to determine a final score. The city with the highest average ranking received a score of 100, ranking as the city with the worst economic environment for single mothers. The city with the lowest average ranking received a score of 0, ranking as the city with the best economic environment for single mothers.
Tips for Navigating Parenting Expenses
- Set up a budget. Parenting comes with several of life’s expenses which require a delicate level of balance, but you can gain financial control with budgeting. Our budget calculator can give you a clear picture of your current spending but also visualize the next six months and show you where cutting back on excess expenses can maximize your savings.
- Take advantage of federal and state programs. Whatever the economic situation in your city, there are programs such as Head Start, Medicare, Medicaid, the Supplemental Nutrition Assistance Program (SNAP) meant to ease the stresses of parenting. In addition, there is a child tax credit available to eligible households.
- Work with a professional. A financial advisor can guide you through important financial decisions and assess your current situation. SmartAsset’s free tool matches you with up to three financial advisors who serve your area, and you can interview your advisor matches at no cost to decide which one is right for you. If you’re ready to find an advisor who can help you achieve your financial goals, get started now.
Questions about our study? Contact press@smartasset.com.
Photo credit: © iStock/lechatnoir
