 Written by
Renewable energy will play a pivotal role in the world’s attempt to curb the effects of climate change. The landmark Paris Agreement signed by 196 countries seeks to limit global temperature rise to 1.5 degrees Celsius above pre-industrial levels. To do this, global emissions of carbon dioxide must fall 45% by 2030 and be virtually eliminated by 2050.
The good news is the world is making progress expanding renewable energy. By 2026, global renewable electric capacity is projected to rise more than 60% from 2020 levels. The bad news? Renewables must grow even faster than these forecasts to achieve net zero emissions by 2050, according to the International Energy Agency.
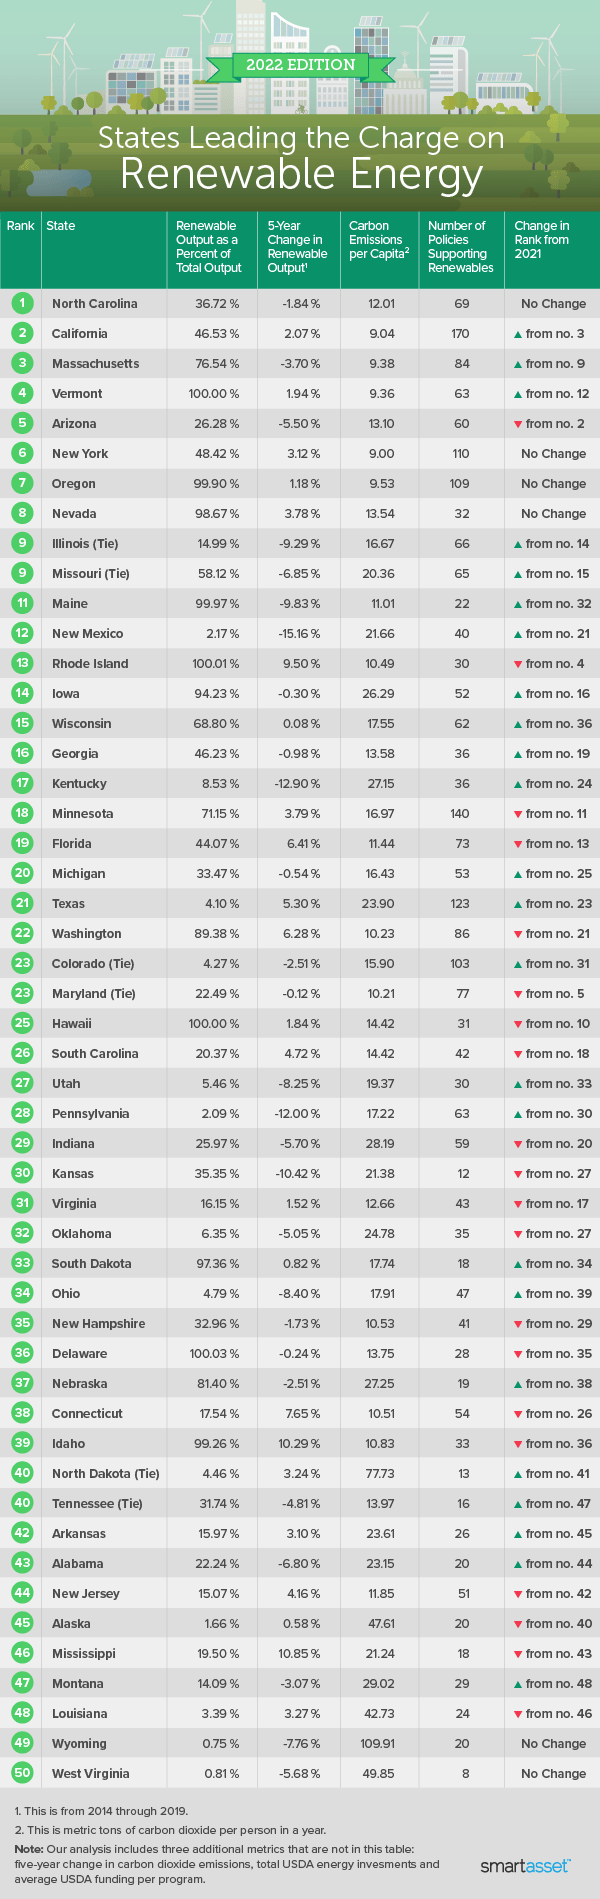
In the U.S., the adoption of renewable energy varies from state to state. To determine what parts of the country are leading the charge, we compared the 50 states across the following seven metrics: renewable energy as a percentage of total energy production, five-year change in renewable energy production, carbon dioxide emissions per capita, five-year change in carbon dioxide emissions, total amount of U.S. Department of Agriculture (USDA) funding for renewable energy, average amount spent on energy programs and number of policies and incentives that focus on renewables. For more details on how we analyzed the data and compiled the rankings, read the data and methodology section below.
This is SmartAsset’s third study on states leading the charge on renewable energy. You can read the 2021 study here.
Key Findings
- North Carolina remains No. 1. For the second year in a row, North Carolina is leading the charge on renewable energy. The state increased its production of renewables by nearly 52% between 2014 and 2019, which is double the average of all 50 states. The Tar Heel State also received by far the most USDA funding from 2004 to 2021: $1.5 billion.
- Emissions are falling, but not quickly enough. Though many researchers estimate that carbon emissions must be cut in half over the next decade, recent national decreases have been minimal. From 2013 to 2018, U.S. carbon emissions fell by only -1.40%. Across the 50 states, Arizona leads the way for its five-year change in carbon emissions (-15.16%) while Mississippi ranks worst (10.85%).
- West Virginia is last, again. Known for its coal mining, it’s no surprise that West Virginia ranks last for its focus on renewables. In fact, this is the third time the state is at the bottom of our rankings. West Virginia has the fewest statewide policies and incentives geared toward renewable energy (8) and ranks second-worst for renewable energy as a percentage of total energy production (0.81%).
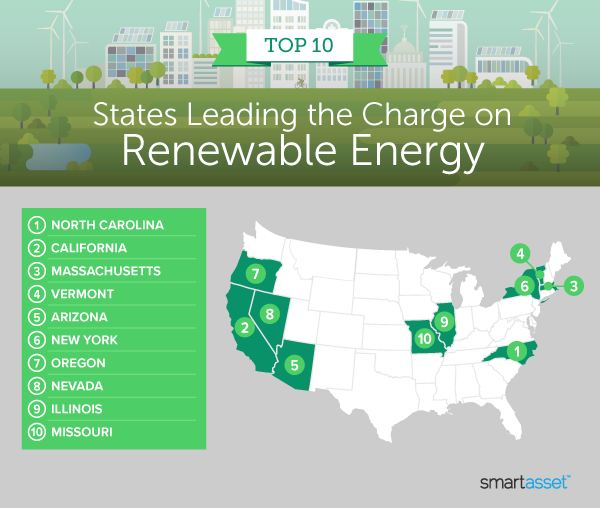
1. North Carolina
Over the five-year period from 2014 to 2019, North Carolina increased its renewable energy output by 51.92%, which ranks eighth-highest across all 50 states. In addition to receiving the most USDA energy investments between 2004 and 2021, North Carolina also has the 11th-most policies and incentives focused on renewable energy (69). Finally, renewable energy made up 36.72% of all energy produced in the state in 2019, which ranks 21st out of the 50 states.
2. California
The nation’s most populous state is also second-best for its focus on renewable energy. California had the second-fewest carbon dioxide emissions per capita in 2018, at 9.04 metric tons per person. California also had the 10th-largest increase (48.75%) in renewable energy production between 2014 and 2019. The Golden State received the third-most USDA funding for renewable energy from 2004 to 2021, when the state took in about $557.8 million in federal dollars. Additionally, no state has more incentives and policies geared toward renewables than California, which has 170.
3. Massachusetts
Massachusetts jumped six spots in this year’s rankings thanks in part to having the fourth-fewest carbon dioxide emissions per capita (9.38 metric tons per person). Renewables comprised 76.54% of all energy produced in the Bay State in 2019, the 13th-highest percentage across our study. Massachusetts also has the eighth-most policies and incentives geared toward renewable energy (84) and the 17th-largest reduction in carbon dioxide emissions, with emissions falling by 3.70% from 2013 to 2018.
4. Vermont
Vermont, which entered the top 10 after being ranked 12th overall a year ago, has the third-fewest carbon dioxide emissions per capita (9.36 metric tons). The state also recorded the 15th-largest increase in renewable energy production between 2014 and 2019, when output jumped 24.52%. Despite being one of the least populous states in the country, Vermont ranks 20th for its number of policies and incentives focused on renewable energy (63).
5. Arizona
Arizona ranks seventh for energy assistance from the USDA ($353.1 million) and fifth for average amount spent per program ($556,910). Between 2013 and 2018, Arizona cut its carbon dioxide emissions by 5.50%, which ranks as the 17th-largest reduction in the nation during that five-year period.
6. New York
The Empire State ranks No. 1 for carbon dioxide emissions per capita (9.00 metric tons per person) and fourth overall for its number of policies and incentives geared toward renewable energy (110). New York also received the 14th-most USDA assistance between 2004 and 2021, having taken in $264.1 million in federal funding for renewable energy and energy efficiency projects.
7. Oregon
Oregon has the fifth-fewest carbon dioxide emissions per capita, at 9.53 metric tons per person. The state also has the fifth-most policies and incentives focusing on renewable energy in the country (109) and received the eighth-most USDA investments ($343.9 million) for renewable energy and energy efficiency projects from 2004 to 2021. Finally, renewables make up nearly 100% of the state’s total energy production.
8. Nevada
No state allocates more USDA dollars per project than Nevada, at nearly $1.5 million per initiative. The state, which received the ninth-most total USDA funding ($317.5 million), also posted the sixth-largest increase in renewable energy production from 2014 to 2019 (63.53%).
9. Illinois (Tie)
Illinois entered this year’s top 10 after ranking 14th overall in our 2021 study edition. The state recorded the sixth-largest reduction of total carbon dioxide emissions from 2013 to 2018 when emissions fell by 9.29%. The Land of Lincoln also has the 12th-most policies and incentives geared toward renewable energy (66).
9. Missouri (Tie)
Like Illinois, Missouri cracked this year’s top 10 after its No. 15 rank a year ago. Between 2014 and 2019, the state increased its renewable energy production by 49.88%, the ninth-best rate across our study. Missouri also made progress on reducing its carbon footprint, cutting total carbon dioxide emissions by 6.85% from 2013 to 2018 (the 10th-best).
Data and Methodology
To find the states leading the charge on renewable energy, SmartAsset looked at data for all 50 states. Specifically, we compared the states across the following seven metrics:
- Renewable output as a percentage of total energy production. This is renewable energy production divided by total energy produced in each state. Data is for 2019 and comes from the Energy Information Administration (EIA).
- Five-year change in renewable energy output. Data comes from the Energy Information Administration (EIA) and is for 2014 to 2019.
- Carbon dioxide emissions per capita. Data comes from the Energy Information Administration (EIA) and is for 2018. Units are in metric tons of carbon dioxide per person.
- Five-year change in carbon emissions. Data comes from the Energy Information Administration (EIA) and is for 2013 to 2018. Units are million metric tons of carbon dioxide.
- Total USDA energy investments. This is the total amount of funding received by the state from 2004 to 2021 from the U.S. Department of Agriculture (USDA) for renewable energy and energy efficiency projects and investments. Data was pulled in February 2022.
- Average USDA funding per program. This is the total USDA energy investment amount divided by the number of USDA-funded programs in the state. Data was pulled in February 2022.
- Number of policies and incentives encouraging renewable energy development. This includes grants, loans, rebates and tax credits. Data comes from the Database of State Incentives for Renewables and Efficiency (DSIRE) and was pulled in February 2022.
To create our final score we ranked each state in each metric. Then we found each state’s average ranking, giving equal weighting to all metrics except total USDA energy investments and average USDA funding per program, which each received a half weight. We used this average ranking to create our final score. The state with the best average ranking received a score of 100. The state with the worst average ranking received a score of 0.
Tips for Being More Sustainable
- Consider a home solar system. If you’re a homeowner, solar panels can help you reduce your carbon footprint and save you money on electricity. Scott Lasky, president of the Santa Cruz, California-based Sandbar Solar & Electric, recommends taking advantage of a 26% federal tax credit on systems installed in 2022. That tax incentive will drop to 22% in 2023 and expire in 2024. “You are also able to send excess energy back to your utility company through a program called Net Energy Metering (NEM) for energy credits you can use to offset your night-time electricity use,” Lasky said.
- Purchase offset credits. Not everyone has direct access to renewable energy sources to power their homes. “Instead, many retailers have options where they purchase the offsets on your behalf if you choose to be supplied by green energy,” said Rhea Henry of EnergyRates.ca. “The money funds the start and maintenance of renewable projects, such as wind and solar farms, and even if your grid is powered by fossil fuels, your own consumption of this energy will be mitigated.”
- Plan and save with a financial advisor. Whether it’s buying an electric vehicle or outfitting your home with solar panels, a financial advisor can help you plan and save for these major expenditures. Finding a qualified financial advisor doesn’t have to be hard. SmartAsset’s free tool matches you with up to three financial advisors who serve your area, and you can interview your advisor matches at no cost to decide which one is right for you. If you’re ready to find an advisor who can help you achieve your financial goals, get started now.
Photo credit: ©iStock.com/artJazz