 Written by
The average 401(k) balance in the U.S. hit $123,900 in the first quarter of 2021, according to a recent report by Fidelity Investments. This marks more than a 70% increase from the average 401(k) balance a decade before ($72,800). But while balances are increasing among individuals with 401(k)s, a significant number of workers in the U.S. – close to 47 million, according to our estimates using Bureau of Labor Statistics (BLS) data – do not have access to either a 401(k) or any other employer-sponsored retirement plan.
In this study, we take a closer look at employer-sponsored retirement benefits in the U.S. Specifically, we consider access, participation and take-up rates. The take-up rate is the percentage of workers with access to a plan who choose to also participate in the plan. We examine those rates over time and look at differences across types of plans (i.e. defined benefit versus defined contribution). Finally, we explore how employer-sponsored retirement benefits vary according to occupation. For details on our data sources and how we put the information together to create our findings, check out the Data and Methodology section below.
Key Findings
- Take-up rates are declining slightly. From 2010 to 2020, the number of workers who had access to an employer-sponsored retirement plan and chose to participate in it fell by two percentage points, from 80% to 78%. The take-up rate additionally declined in five of the nine occupational categories we looked at, falling the most for sales workers (66% to 60%) along with installation, maintenance and repair workers (84% to 78%).
- Retirement benefit access is lowest among service workers. In 2020, only about 46% of service workers in the U.S. had access to employer-sponsored retirement benefits. Additionally, less than seven in 10 service workers with access to those benefits chose to participate in them.
- Occupational divides are widening. In 2010, 86% of management, business and financial workers had access to employer-sponsored retirement benefits compared to only 49% of service workers. In 2020, the spread exceeded 40 percentage points. About 89% of management, business and financial workers had access to retirement benefits through their employer, compared to 46% of service workers.
Access, Participation and Take-Up Rates Over Time
Over the past decade, there has been a slight uptick in the percentage of workers with access to employer-sponsored retirement plans. According to data from the BLS’ National Compensation Survey, about 71% of civilian workers had access to employer-sponsored retirement benefits in 2020 – two percentage points higher than the percentage of workers with access in 2010.
Though access rates have risen, participation rates have held steady, resulting in a declining take-up rate. Fewer workers are choosing to participate in employer-sponsored retirement benefits. In 2010, about 80% of workers with access to retirement benefits through work participated in those plans, compared to 78% in 2020. The chart below shows access, participation and take-up rates from 2010 to 2020 for all employer-sponsored retirement plans.

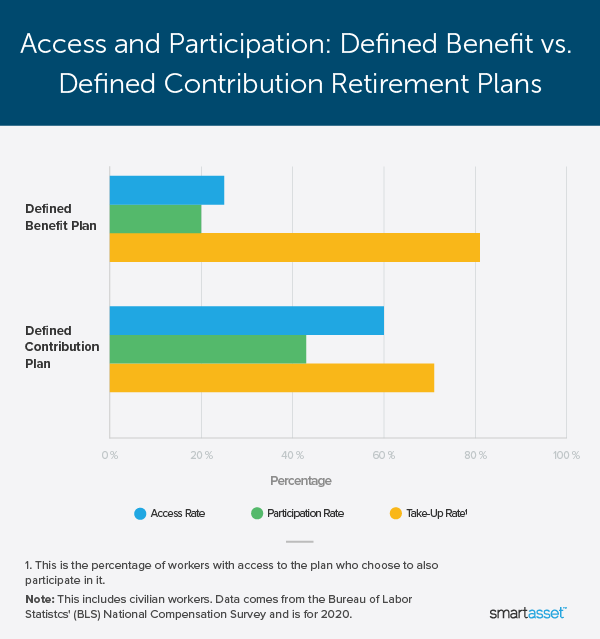
Plan Types: Defined Benefit vs. Defined Contribution
Employer-sponsored retirement benefits fall into two major categories: defined benefit plans – commonly known as traditional pension plans – and defined contribution plans. Broadly, a defined benefit plan promises a specified monthly benefit at retirement while a defined contribution plan does not.
Defined benefit plans usually calculate a benefit through a formula that considers factors such as salary and years of service. Within a defined contribution plan, either the employee, the employer or both parties contribute to the employee’s individual plan account. Contributions are typically invested and the employee receives the balance in retirement. Types of defined contribution plans include 401(k) plans, 403(b) plans, employee stock ownership plans and profit-sharing plans.
In general, most U.S. employers offer either a defined benefit plan or a defined contribution plan – but rarely both. In 2020, just 15% of workers had access to both defined benefit and defined contribution plans. Meanwhile, 10% of workers had access to only a defined benefit plan and roughly 45% of workers had access to only a defined contribution plan.

The prevalence of defined contribution plans relative to defined benefit plans marks a significant shift from 40 years ago, when the traditional pension plan was much more common. Even in the past five years, defined contribution plans have gained ground over defined benefit plans. In 2015, 12% of workers had access to only a defined benefit plan, 41% had access to only a defined contribution plan and 16% had access to both.
Today, the take-up rate is higher among workers with access to a defined benefit plan. About 81% of civilian workers with access to a defined benefit plan participate in those benefits. Meanwhile, the take-up rate among workers with access to a defined contribution plan is 71%. The table below shows differences in access, participation and take-up rates by type of plan.
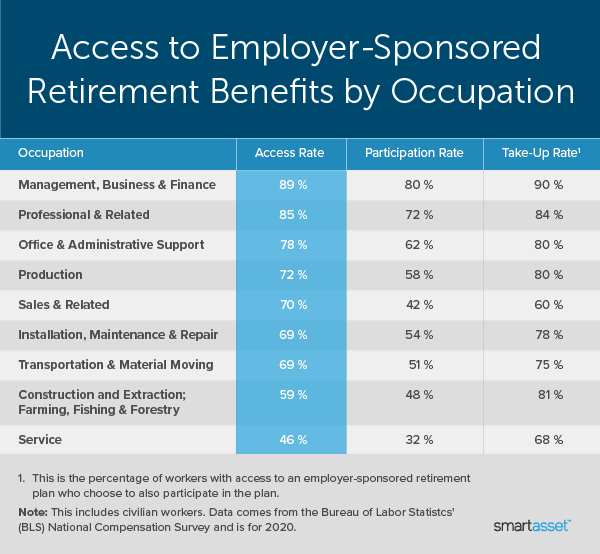
Retirement Benefits by Occupation
The BLS publishes access, participation and take-up rates for all employer-sponsored retirement plans according to nine defined occupational categories. Two categories – management, business and financial occupations along with professional and related occupations – had access rates higher than 80% in 2020. The retirement benefit take-up rate is also highest among workers in those two industries. About 90% of management, business and financial workers and roughly 84% of professional and related workers chose to participate in the employer-sponsored benefits they were offered.
Access rates are lowest for service workers, while take-up rates are lowest among sales workers. In 2020, less than one in two service workers had access to either a defined benefit or defined contribution plan through their employer. Meanwhile, though 70% of sales workers had employer-sponsored retirement benefits, the take-up rate was 60%. The table below shows access, participation and take-up rates across the nine defined BLS occupations in 2020.
Data and Methodology
Data for this report comes from Fidelity’s quarterly analysis of retirement savings and the Bureau of Labor Statistics’ (BLS) National Compensation Survey. Fidelity’s estimates are based on an analysis of 23,500 corporate defined contribution plans. For the three sections of the report that use BLS data, we considered only civilian workers, who include private industry along with state and local government workers. Federal government, military and agriculture workers are excluded from estimates.
Tips for Maximizing Your Retirement Savings
- Start early. It is very important when saving for retirement through a defined contribution plan to take advantage of compound interest by planning and saving early. Compound interest can make a huge difference. For instance, if you invested $10,000 at the beginning of your career and continued to invest $10,000 annually, it would grow to more $400,000 in 30 years, assuming a conservative 2% rate of return. Assuming a higher rate of return of 5%, that investment would grow to more than $700,000. Take a look at our investment calculator to see how your savings can grow over time.
- Maximize your match. Some employers match 401(k) contributions up to a certain percentage of your salary, meaning that if you choose not to contribute the full amount of your match, you are leaving money on the table. Check out our 401(k) calculator if you need help determining what you saved for retirement so far and how much more you may need.
- Combined balances are higher. Fidelity’s report shows that people with balances in both a defined contribution plan and an IRA have higher average balances than people only saving through one retirement vehicle. In the first quarter of 2021, the average combined balance for savers with both a workplace retirement plan and an IRA was $375,100. Our article here explains how you can contribute to both.
- Consider a financial advisor. A financial advisor may help you be better in control of your money and make sure you are on the right track for retirement. SmartAsset’s free tool matches you with financial advisors in five minutes. If you’re ready to be matched with local advisors that may be able to help you achieve your financial goals, get started now.
Questions about our study? Contact us at press@smartasset.com.
Photo credit: ©iStock.com/insta_photos