 Written by
With higher housing costs and smaller living spaces, many large cities are less conducive to families. According to Census Bureau data, average monthly housing costs for homeowners across the 100 largest U.S. cities are more than 23% higher than the national average.
Some large cities buck the trend, however. In this study, SmartAsset looked at data on 100 of the largest U.S. cities to identify the best cities to buy an affordable family home. We considered seven metrics: the percentage of homes with at least two bedrooms, the four-year change in homeownership rate, two affordability measures (down payment-to-income ratio and housing costs as a percentage of income) and three livability statistics (high school graduation rate along with property and violent crime rates). For details on our data sources and how we put all the information together to create our final rankings, check out the Data and Methodology section below.
This is SmartAsset’s second annual study on the best cities to buy an affordable family home. Check out our 2020 edition here.
Key Findings
- There is consistency across our top 10. Seven of the top 10 cities to buy affordable family homes in this year’s study edition overlap with our list last year. The three new top-ranking cities are all in Texas – Corpus Christi, Garland and Lubbock.
- A wide range of down payment-to-income ratios. Our down payment-to-income ratio assumes a 20% down payment on the median-valued home divided by the median household income. Detroit, Michigan has the lowest down payment-to-income ratio, at 0.35, while Los Angeles has the highest, at 2.07. The average down payment-to-income ratio across the top 25 cities in our study is 0.74, meaning that down payments for most homeowners in those cities will be less than their annual income.
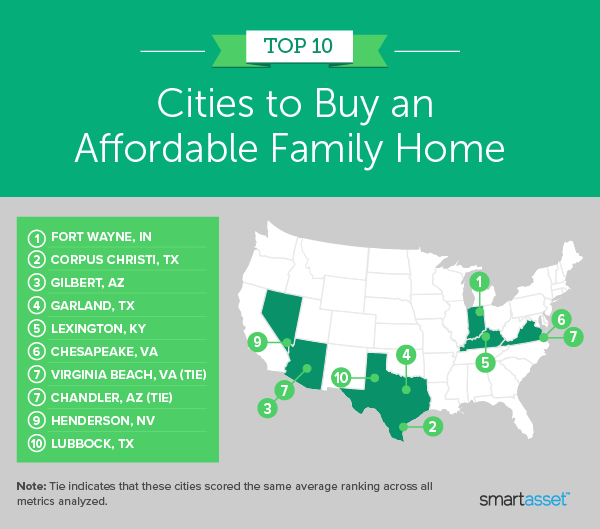
1. Fort Wayne, IN
Fort Wayne, Indiana ranks in the top fourth of cities for five of the seven metrics we considered. It has the 19th-highest percentage of homes with two or more bedrooms (98.7%) and ranks fourth-best for our two metrics measuring affordability: down payment-to-income ratio (0.50) and housing costs as a percentage of income (19.47%). The city is also relatively family friendly. The high school graduation rate exceeds 90% and there were only about 362 violent crimes for every 100,000 residents in 2019, the 23rd-lowest rate in our study.
2. Corpus Christi, TX
Located on the Gulf of Mexico, Texas’ Corpus Christi ranks as the No. 2 city to buy an affordable family home. Census Bureau data shows that from 2015 to 2019, the homeownership rate increased by more than four percentage points. Additionally, Corpus Christi has the 10th-best down payment-to-income ratio (0.57) and the 14th-highest percentage of homes with at least two bedrooms (98.9%). Though property and violent crime rates fall behind most other cities in our top 10, Corpus Christi has the eighth-highest high school graduation rate of all 100 cities, at 90.78%.
3. Gilbert, AZ
Gilbert, Arizona ranks in the top five cities for four study metrics. They include percentage of homes with at least two bedrooms, housing costs as a percentage of income and low property and violent crime rates. According to data from the Census Bureau, 99.5% of owner-occupied housing units in Gilbert have two or more bedrooms. Additionally, median annual housing costs for homeowners make up less than 19% of the city’s median household income ($102,793). Finally, in 2019, there were about 1,200 and 100 property and violent crimes for every 100,000 residents, respectively.
4. Garland, TX
Garland, Texas ties for fourth-highest percentage of homes with two or more bedrooms (99.4%). Garland also ranks 17th-best on our two metrics measuring affordability: down payment-to-income ratio and housing costs as a percentage of income. Census Bureau data shows that the down payment-to-income ratio is 0.61 and median housing costs made up only about 22% of the city’s median household income, $62,556.
5. Lexington, KY
Lexington, Kentucky ranks in the top third of cities for five of the seven metrics in our study. It ties for the fourth-highest percentage of homes with at least two bedrooms (99.4%), has the 24th-lowest housing costs as a percentage of income (22.35%) and also has the 30th-best high school graduation rate. Furthermore, the city has the 32nd-best down payment-to-income ratio overall. Finally, there were less than 300 violent crimes for every 100,000 residents in 2019 – a top 15 rate.
6. Chesapeake, VA
Chesapeake, Virginia ranks slightly lower this year compared to its No. 1 spot last year. Between the two years, the down payment-to-income ratio increased from 0.68 to 0.75, while the high school graduation rate fell from 93.10% to 90.00%. Despite those changes, Chesapeake still takes the No. 37 and No. 10 spots for those two metrics, respectively. Additionally, 99.6% of homes in Chesapeake have two or more bedrooms – the second-highest rate overall for this metric – and there are less than 2,300 property crimes for every 100,000 residents, the 26th-best rate.
7. Virginia Beach, VA (tie)
Virginia Beach, Virginia ranks in the top 15 cities for four metrics. It has the eighth-highest percentage of homes with two or more bedrooms (99.3%) and ties for the 1oth-highest high school graduation rate (90.00%). Additionally, crime rates are relatively low. In 2019, there were less than 130 violent crimes and 1,800 property crimes per 100,000 residents. Virginia Beach falls the farthest behind when it comes to its four-year change in homeownership rate. From 2015 to 2019, the homeownership rate remained relatively flat.
7. Chandler, AZ (tie)
From 2015 to 2019, the homeownership rate in Chandler, Arizona increased by more than four percentage points, the eighth-highest rate in our study. Additionally, families may appreciate the relatively low violent crime rate and high number of large homes. Data from the FBI and Census Bureau, respectively, shows that there were less than 230 violent crimes in 2019 for every 100,000 residents and that almost 99% of owner-occupied homes and apartments in the city have two or more bedrooms.
9. Henderson, NV
Henderson, Nevada moves up a spot this year, ranking 1oth last year. Henderson has the ninth-highest percentage of homes with two or more bedrooms (99.1%) and the seventh-lowest housing costs relative to income (20.26%). It also has the 11th- and eighth-lowest property and violent crime rates, respectively.
10. Lubbock, TX
Lubbock, Texas ranks in the top 20 cities for three metrics: down payment-to-income ratio (0.58), percentage of homes with at least two bedrooms (98.8%) and high school graduation rate (92.17%). Though property and violent crime rates are higher than other cities in our top 10, the homeownership rates are rising in the city. From 2015 to 2019, the homeownership rate increased by two percentage points from 49.49% to 51.49%.

Data and Methodology
To find the best cities to buy an affordable family home, SmartAsset looked at data for 100 of the largest cities in the U.S. We compared cities across seven metrics:
- Percentage of homes with at least two bedrooms. This is the number of owner-occupied homes with at least two bedrooms divided by all owner-occupied homes. Data comes from the Census Bureau’s 2019 1-year American Community Survey.
- Four-year change in homeownership rate. This is the difference between the 2015 and 2019 homeownership rates. Data comes from the Census Bureau’s 2015 and 2019 1-year American Community Surveys.
- Down payment-to-income ratio. This is a 20% down payment on the median-valued home divided by the median household income. Data comes from the Census Bureau’s 2019 1-year American Community Survey.
- Housing costs as a percentage of income. This is median annual housing costs for owner-occupied housing units divided by the median household income. Data comes from the Census Bureau’s 2019 1-year American Community Survey.
- High school graduation rate. Data comes from the 2021 County Health Rankings.
- Property crime rate. This is the number of property crimes per 100,000 residents. Data comes from the FBI Uniform Crime Reporting Program and is for 2019. We used data from Neighborhood Scout for cities where FBI data was not available.
- Violent crime rate. This is the number of violent crimes per 100,000 residents. Data comes from the FBI Uniform Crime Reporting Program and is for 2019. We used data from Neighborhood Scout for cities where FBI data was not available.
We ranked each city in every metric, giving a half weighting to property and violent crime rates and a full weighting to all other metrics. We then found each city’s average ranking and used the average to determine a final score. The city with the highest average ranking received a score of 100. The city with the lowest average ranking received a score of 0.
Home Buying Tips
- Be realistic. Make sure you know how much house you can afford before you even start looking at homes so you don’t fall in love with a unit that is above your price range.
- Consider a financial advisor. Buying a home is a big decision and it may be a good idea to consult a financial advisor to better understand your financial situation and what kind of house you can afford. SmartAsset’s free tool matches you with financial advisors in five minutes. If you’re ready to be matched with advisors that will help you achieve your financial goals, get started now.
Questions about our study? Contact us at press@smartasset.com.
Photo credit: ©iStock.com/Dean Mitchell