 Written by
Coronavirus has hit America’s senior population especially hard in terms of health, but the pandemic has also highlighted issues that some people 65-and-older already face with regard to their finances. Balancing medical bills on top of basic expenses for food and shelter – in addition to making sure one has enough retirement savings – can be a challenge. That’s why SmartAsset decided to take a look at where in the U.S. seniors are most and least financially secure.
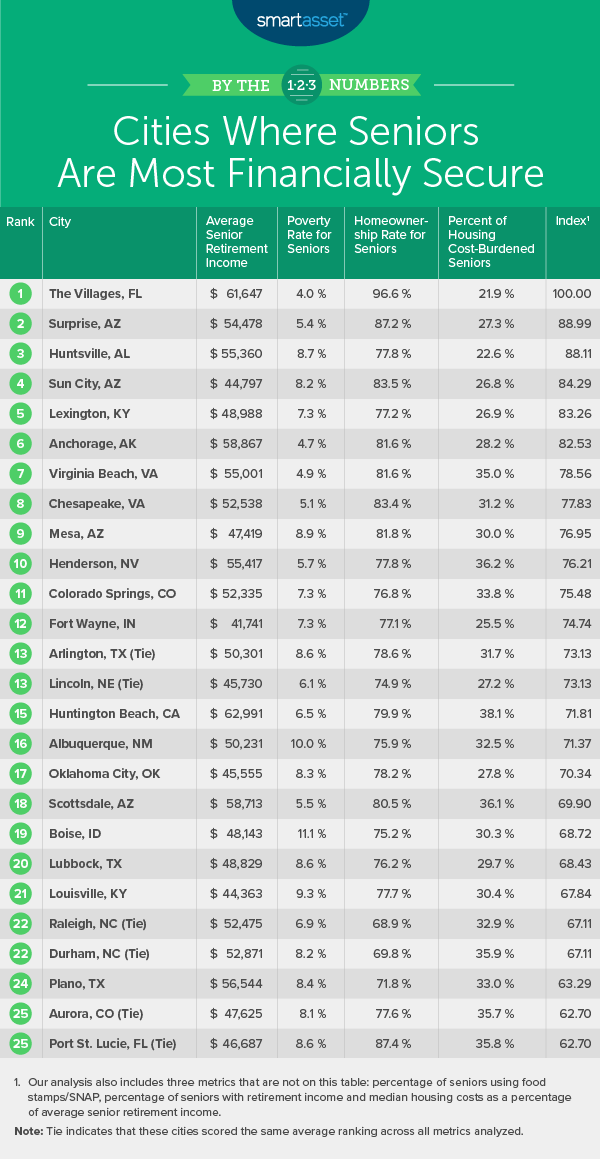
To find the cities where seniors are most and least financially secure, we examined data for the 100 cities with the largest 65-and-older population across seven metrics: average senior retirement income, percentage of seniors below the poverty line, percentage of seniors receiving Supplemental Nutrition Assistance Program (SNAP) benefits, percentage of seniors who own their homes, percentage of seniors with retirement income, percentage of seniors who are housing cost-burdened and housing costs as a percentage of average senior retirement income. For details on our data sources and how we found our final rankings, check out the Data and Methodology below.
Key Findings
- Southern and Western cities dominate the top 10. The top 10 cities in our study where residents 65 and older are most financially secure are spread equally across only Southern and Western states. Three Arizona cities make it into the top 10 – Surprise, Sun City and Mesa – all ranking within the top 10% of the study for their high percentages of seniors who own their homes. Two Virginia cities rank in the top 10 as well – ranking within the top 5% of the study for both their relatively low percentages of seniors below the poverty line and high percentages of seniors with retirement income.
- Large gaps across cities for the percentage of seniors living below the poverty line. Across the top 10 cities in our study, the average percentage of seniors living in poverty is approximately 6%. By contrast, the average percentage of seniors below the poverty line across the bottom 10 cities in our study is more than three times that figure, at about 20%.
- Retirement income is a concern, even in cities where seniors are most financially secure. Even though the top 10 cities where seniors are most financially secure all rank within the top 25% of the study for their percentage of seniors with retirement income, Census Bureau data shows that there are still many local seniors who do not have additional retirement funds saved. An average of more than four in 10 seniors in those cities does not have retirement income from a pension or retirement account such as a 401(k) or IRA.
Cities Where Seniors Are Most Financially Secure
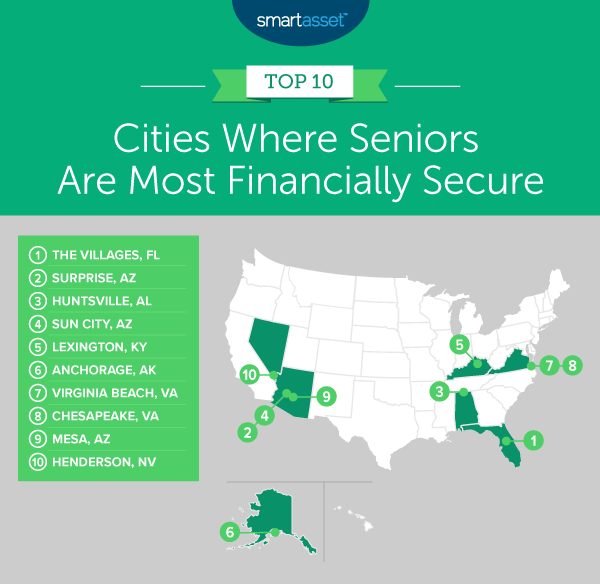
1. The Villages, FL
The Villages, Florida ranks No. 1 in five of the seven metrics we considered. Less than 5% of seniors there live below the poverty line, less than 1% of seniors receive assistance through SNAP and almost 97% of seniors own their homes. Additionally, only about two of every 10 seniors in The Villages are housing cost-burdened (i.e. spend more than 30% of their income on housing costs), and housing costs make up just 13% of average senior retirement.
2. Surprise, AZ
Surprise, Arizona ranks within the top five of the study for four of the seven metrics we considered: low percentages of seniors below the poverty line and receiving assistance through SNAP as well as high percentages of seniors who own their own homes and have retirement income. Additionally, its average senior retirement income, which includes both income from pensions and retirement accounts along with Social Security income, is $54,478 – the 18th-highest in our study.
3. Huntsville, AL
Huntsville, Alabama ranks in the top five of our study for its high percentage of seniors with retirement income, at almost 59%, its low percentage of seniors who are housing cost-burdened, at 22.6%, as well as its low housing costs as a percentage of average senior retirement income, at just above 18%. The average senior retirement income in Huntsville is $55,360.
4. Sun City, AZ
Although the average senior retirement income in Sun City, Arizona, at $44,797, is the lowest figure for this metric across the top five cities where seniors are most financially secure, housing costs in the city are low and comprise only 15.0% of this amount. Sun City ranks within the top 5% of the study for this metric along with three others: percentage of seniors receiving assistance from SNAP (less than 3%), percentage of seniors who own their own homes (almost 84%) and percentage of seniors who are housing-cost burdened (less than 27%).
5. Lexington, KY
Lexington, Kentucky has the fifth-lowest percentage of seniors who are housing cost-burdened, at 26.9%. Additionally, it has the 11th-lowest rate in the study of seniors living below the poverty line, at about 7%, and the 11th-highest rate in the study for seniors with retirement income from private means, at about 53%. The average senior retirement income in Lexington is almost $49,000, which ranks within the top half of the study.
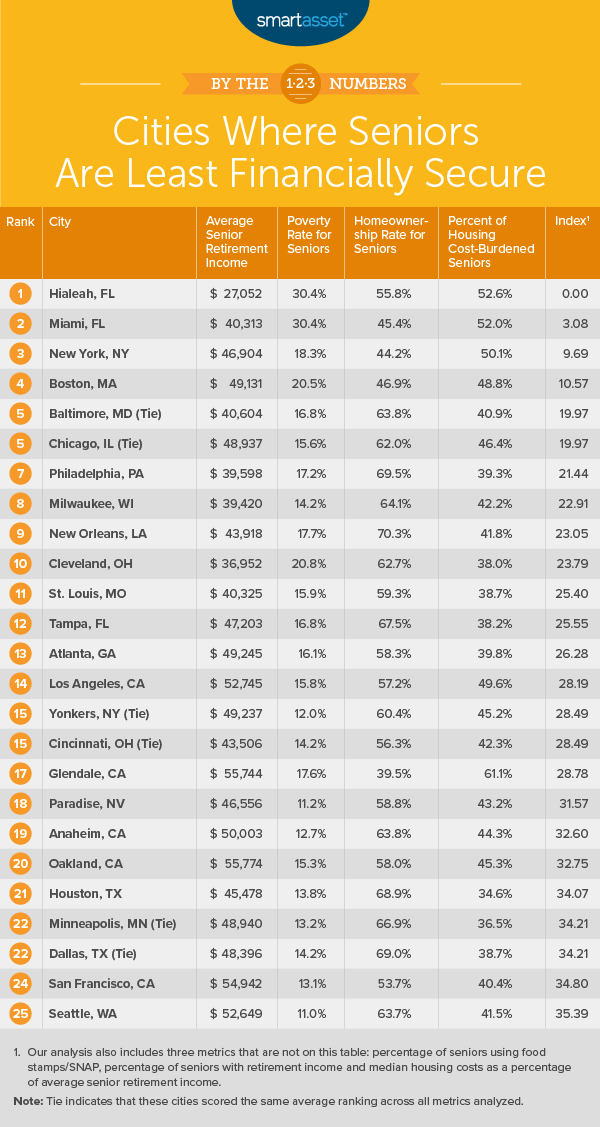
Cities Where Seniors Are Least Financially Secure
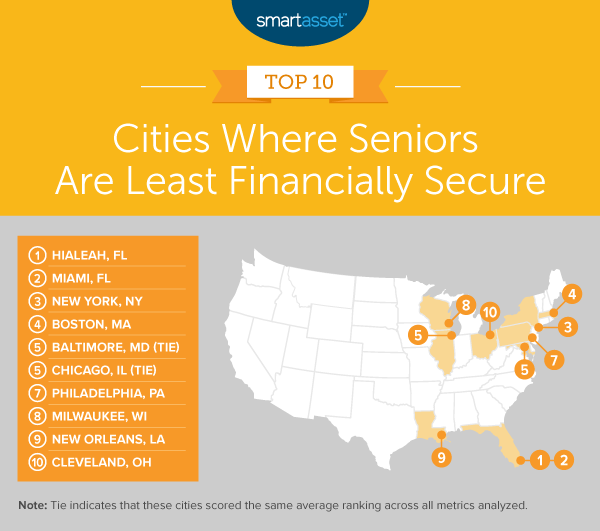
1. Hialeah, FL
Hialeah, Florida ranks in the bottom 2% of the study for six out of the seven metrics we considered. It has the lowest average senior retirement income, at $27,052, and housing costs make up more than 47% of this amount. More than half of the senior population is housing cost-burdened. The percentage of 65-and-older residents in Hialeah living below the poverty line exceeds 30%, and the percentage of seniors who are assisted by SNAP or food stamps exceeds 51%. Less than 16% of seniors in Hialeah have retirement income from pensions or retirement accounts.
2. Miami, FL
Miami, Florida ranks in the bottom 3% for five of the seven metrics we considered in our study: its relatively high percentages of seniors who are below the poverty line, assisted by SNAP and housing-cost burdened as well as its relatively low percentages of seniors who own their own homes and who have retirement income. The average senior retirement income in Miami is approximately $40,300, and only 16.2% of the 65-and-older population have retirement income. Furthermore, close to one in two seniors in Miami is assisted by SNAP.
3. New York, NY
New York, New York ranks within the bottom 8% of the study for five out of the seven metrics we considered. Housing costs there comprise more than 37% of the average senior retirement income ($46,904), and more than half of the 65-and-older population is housing cost-burdened. Additionally, 18.3% of New York City seniors are living below the federal poverty line.
4. Boston, MA
Although the average senior retirement income in Boston, Massachusetts, at $49,131, ranks within the top half of the study, the city ranks within the bottom 6% of cities for all other metrics. More than one in five Boston seniors live below the poverty line, according to 2018 Census Bureau data. Furthermore, about 28% of seniors receive assistance for food through SNAP or food stamps, and almost half of all seniors in the city are housing cost-burdened. In fact, housing costs in the city are so high that they comprise more than 40% of the average senior retirement income.
5. Baltimore, MD (Tie)
In 2018, the average senior retirement income in Baltimore, Maryland was $40,604. Housing costs make up about one-third of this amount, and while more than six in 10 Baltimore residents age 65 and older own their homes, about four in every 10 Baltimore seniors is burdened by housing costs from either owning or renting. Furthermore, almost 17% of seniors live below the poverty line and about 21% of them receive financial assistance to purchase food through SNAP.
5. Chicago, IL (Tie)
Chicago, Illinois has the seventh-highest rate in the study of seniors who are housing cost-burdened, at 46.4%. Housing costs comprise almost 30% of the average senior retirement income, which is less than $49,000. More than 15% of Chicago residents ages 65 and older live below the poverty line, and more than 20% of them receive food assistance through SNAP or food stamps.
Data and Methodology
To find the cities where seniors are most and least financially secure, we looked at data for the 100 cities with the largest 65-and-older populations, across the following seven metrics:
- Average senior retirement income. This is private retirement income from savings, IRA, 401(k) or pensions, along with Social Security income, for households in which the head of household is 65 or older.
- Percentage of seniors below the poverty line. This is the percentage of seniors who live below the federal poverty line.
- Percentage of seniors who receive food stamps/SNAP benefits. This is the percentage of households that receive food stamps for households in which the head of household is 65 or older.
- Percentage of seniors who own their homes. This is the percentage of households in which the head of household is 65 or older and the residents own their home.
- Percentage of seniors with retirement income. This is the percentage of households in which the head of household is 65 or older which have retirement income from private means. This includes money from income streams such as annuities, insurance, IRAs and retirement pensions.
- Percentage of seniors who are housing cost-burdened. This is the percentage of households in which the head of household is 65 or older and spends 30% or more of income on housing costs. This includes both owners and renters.
- Housing costs as a percentage of average senior retirement income. This is median annual housing costs divided by average senior retirement income, from both private means along with Social Security income.
Data for all metrics comes from the Census Bureau’s 2018 5-year American Community Survey.
First, we ranked each city in each metric. Then we found each city’s average ranking, assigning each metric an equal weight. Using this average ranking, we created our final score. The city with the highest average ranking received a score of 100. The city with the lowest average ranking received a score of 0.
Tips for Becoming More Financially Secure
- COVID-19 resources. If you seek further information on how to plan for your financial future in light of the coronavirus crisis, see our full guide here.
- Reassess your budget if possible. One of the best ways to save more is through budgeting. Our budget calculator can help with this. Beyond letting you see how much you spend each month, you can see how cutting back on discretionary expenses can increase your savings rate.
- Invest in expert advice. If you seek professional advice on how to go about optimizing your finances for retirement, consider speaking to a financial advisor. Finding the right financial advisor who fits your needs doesn’t have to be hard. SmartAsset’s free tool matches you with financial advisors in your area in five minutes. If you’re ready to be matched with local advisors that will help you achieve your financial goals, get started now.
Questions about our study? Contact press@smartasset.com
Photo credit: ©iStock.com/fizkes