 Written by
Mid-sized cities can offer a good compromise between the unaffordable, congested big cities out there and the smaller, sleepy suburbs. But with so many mid-sized cities across the country, it isn’t easy to tell which are the best options. From cities with a lower cost of living where opportunities to save and invest are abundant, to less affordable cities with nicer amenities, mid-sized cities come in many varieties. Below we look to analyze a number of financial factors to rank the most livable mid-sized cities in the U.S.
To rank the best mid-sized cities in America, we excluded the largest 100 cities in the country, and looked at data for the rest of the cities with populations above 100,000. In total, we examined data on 173 cities. We compared them across eight metrics. Specifically, we looked at the change in median home values, monthly housing costs, income inequality, poverty rate, median household income, unemployment rate, uninsured rate and average commute time. Check out our data and methodology below to see where we got our data and how we put it together to create our final rankings.
Key Findings
- Denver metro area ranks well – In total, the Denver metro area has three cities in the top 10 most livable mid-sized cities. These cities tended to combine low unemployment with high potential earnings to create great places to live. One downside is the cost of living all over Denver is rising and thus hurting that city’s scores.
- The most livable places come at a cost – The cities with low unemployment rates, growing home values, low commute times and low poverty rates tend to be pricey. Even accounting for the cost of living, our model ranked cities on the expensive side as more livable.
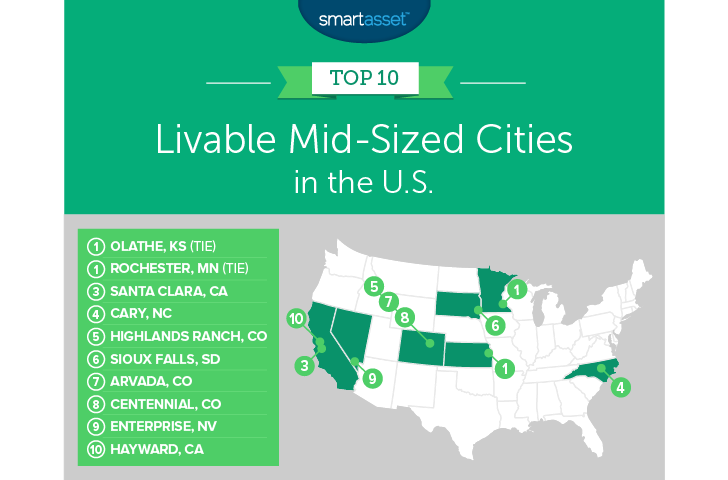
1. (tie) Olathe, Kansas
Olathe comes in tied for first with Rochester, Minnesota. This city is the fourth-largest in Kansas. Olathe takes the top spot thanks to a low poverty rate. According to our data, about one in 25 residents in Olathe falls under the poverty rate. That is the third-lowest rate. Another good sign for the livability of this city is the low inequality. The economic rewards bestowed upon residents of this city are evenly spread. Olathe ranks fourth for Gini coefficient, a measure of income inequality.
1. (tie) Rochester, Minnesota
As mentioned, Rochester and Olathe tied as the most livable mid-sized cities in the country. The economic conditions in Rochester are favorable to leading a secure economic life. Unemployment rates and uninsured rates are low. That suggests the average resident in Rochester has a steady job, with a steady income and doesn’t have to worry too much about a medical emergency depleting his or her savings account. Another benefit to living in Rochester is the ease of getting around. According to our data, the average commute to work is only 16 minutes. That means more time for yourself.
3. Santa Clara, California
Santa Clara takes third. This city is becoming one of the most in-demand places to live. According to our data, the median home increased in value by 66% from 2012 to 2017. This is great news for current homeowners. However, that increase in home values does raise the cost of living, which hurts Santa Clara’s score. Santa Clara is the most expensive city in the top 10. Balancing out those high costs of living are opportunities to earn robust incomes. The median household here earns more than $115,300 per year. Santa Clara residents also have no trouble finding jobs. According to our data, fewer than 3% of residents are unemployed.
4. Cary, North Carolina
One of the safest cities in the country is also one of the most livable mid-sized cities, our data reveals. Cary has a low poverty rate, low unemployment rate and a high median income. In each of those metrics, Cary ranks in the top 15. Combined, those three figures show that most households in Cary are in a stable financial position. Employment is plentiful, and most households should be able to be able to save money.
5. Highlands Ranch, Colorado
The fifth-placed city is Highlands Ranch, Colorado. The economic conditions here are perhaps the best in the study. Overall, Highlands Ranch has the second-lowest poverty rate, the sixth-highest median income, the fourth-lowest unemployment rate and the fourth-lowest uninsured rate. However, Highlands Ranch falls to fifth because of its high cost of living and the relatively long distances residents here travel for work. The average home costs $1,800 per month, and the average commute is nearly 27 minutes.
6. Sioux Falls, South Dakota
South Dakota paves a path to the top 10 mostly thanks to its low cost of living. Few cities in our study are as kind to your wallet as Sioux Falls. In fact, Sioux Falls is the most affordable city in our top 10. Not only are the homes affordable but most residents in Sioux Falls should be able to find stable employment. Stable employment, plus affordable housing, means financial stability. On the quality of life front, most workers in Sioux Falls don’t have to go far to get to work. Sioux Falls ranks sixth for average commute time.
7. Arvada, Colorado
The second of three Colorado cities to crack this top 10 is Arvada. This city is located in the northwestern portion of the Denver metro area. Our data shows that this city is becoming a very popular place to live. For example, the median home here increased in value by 57% from 2012 to 2017. One reason this is such a popular place to live is the booming economy in the region. Well-paying jobs are plentiful here, and few residents find themselves under the poverty line. In both poverty rate and unemployment rate, Arvada has top-30 scores.
8. Centennial, Colorado
To the south of Denver is Centennial, the eighth-most livable mid-sized city in America. This city has a lot going for it. Income-earning opportunities are abundant as shown by the high median income and low unemployment rate. Centennial also has a low poverty rate and low uninsured rate. Specifically, Census Bureau data reveals that about 4.5% of residents in Centennial fall below the poverty line, while only 3.6% have no health insurance. However, like other cities where a lot of people want to live, the cost of living is on the high side. This city ranks in the wrong half for median housing costs.
9. Enterprise, Nevada
In ninth is Nevada’s sole representative in the top 10. Enterprise is a city on the rise, our data suggests. From 2012 to 2017, the median home increased in value by 76%. That is great news for local homeowners and the local tax authorities. Along with rising home values, the vast majority of Enterprise residents have stable employment. The unemployment rate in Enterprise is only 3%.
10. Hayward, California
Hayward, California rounds out our list. Homeowners who have lived in Hayward have profited from its uptick in popularity. Census Bureau data shows that from 2012 to 2017, the median home increased in value by 95%. Only one other city saw a greater increase in home values. Hayward’s access to the bay area puts it in a prime position to reap the benefits of the growing tech economy. The median household here earns more than $89,000 per year. Hayward, like much of California, is plagued by high costs of living. That hurts its overall score: The median home here costs more than $1,800 per month.

Data and Methodology
In order to rank the most livable mid-size cities, SmartAsset looked at data for 173 cities. We looked at data for cities with populations above 100,000, excluding the 100 largest cities in the country. In addition, we excluded cities for which we did not have all the necessary data. Then we compared the remaining cities across the following eight metrics:
- Gini coefficient. This is a measure of income inequality. The Gini coefficient is a number that’s always between 0 and 1, where a score of 0 means a population has achieved perfect equality and a score of 1 represents perfect inequality between rich and poor. Data comes from the U.S. Census Bureau’s 1-Year American Community Survey.
- Median home value change. This is the percent change in median home values from 2012 to 2017. Data comes from the U.S. Census Bureau’s 2017 1-Year American Community Survey.
- Median monthly housing cost. Data comes from the U.S. Census Bureau’s 2017 1-Year American Community Survey.
- Percent of residents below the poverty line. Data comes from the U.S. Census Bureau’s 2017 1-Year American Community Survey.
- Median household income. Data comes from the U.S. Census Bureau’s 2017 1-Year American Community Survey.
- Unemployment rate. Data comes from the U.S. Census Bureau’s 2017 1-Year American Community Survey.
- Percent of residents without health insurance. Data comes from the U.S. Census Bureau’s 2017 1-Year American Community Survey.
- Average commute time. Data comes from the U.S. Census Bureau’s 2017 1-Year American Community Survey.
We began by ranking each city in each metric. Next, we found each city’s average ranking, giving equal weight to each metric. Using this average ranking, we created our final score. The city with the best average ranking received a 100. The city with the worst average ranking received a 0.
Tips for Finding an Affordable Home
- Do all the math – No city is livable if you can’t afford to live there. So when you’re considering becoming a homeowner, it’s important to make sure you consider everything. The mortgage you take on to buy the home will be your largest monthly expense, but property taxes and homeowners insurance can also be sizable expenses. If you’re thinking about becoming a homeowner, check out SmartAsset’s “How Much House Can I Afford?” calculator. It will provide a detailed breakdown of what you can and can’t afford based on property taxes, credit score, mortgage rates and other factors.
- Get an expert’s advice – The number of factors you need to consider when managing your finances can be overwhelming. Are you saving enough money for retirement? Should you become a homeowner? Can you afford to help pay for your children’s college education? Keeping track of all of that can be another full-time job. So instead of trying to do it all yourself, why not let an expert do it for you. A financial advisor can make sure your money is invested in a way that suits your needs. If you are not sure where to find a financial advisor, check out SmartAsset’s financial advisor matching tool. It will match you with up to three local financial advisors who fit your investing preferences.
Questions about our study? Contact us at press@smartasset.com
Photo credit: ©iStock.com/DenisTangneyJr