 Written by
According to the National Center for Education Statistics, as of fall 2012 there were roughly 3.7 million full-time elementary, middle and high school teachers in the U.S. To put that number in context: there are more teachers in America than police officers, physicians, therapists, lawyers, social workers and postal workers combined.1 When you consider the influence teachers can have on their students’ lives, it is no exaggeration to say that teachers collectively hold the most important job in the country.
Find out now: How much do I need to save for retirement?
Yet, for all its importance, that job can at times be less than rewarding. Indifferent students, obnoxious parents, poor pay, a lack of resources; these are among the reasons that teachers often report low levels of job satisfaction. Indeed, a national 2012 survey of teachers found that only 39% were “very satisfied” with their jobs, and more than half felt that they were “under great stress” several days a week.2
The Data
We wanted to find cities in which teachers enjoy good pay, long-term job security and a positive work environment. To do so, we first collected data on teacher income and employment in major metropolitan areas, limiting our focus to areas with at least 5,000 teachers. We then looked at the largest school districts in the principal cities of each of these areas. In all, we collected data on five different factors:
- Disposable income. The median salary for teachers in the metro area, minus the median annual rent for a two bedroom apartment in that metropolitan area.
- Change in employment. The percent change in the total number of teachers employed from 2011 to 2013. Some of the areas in our study saw teacher employment fall over that period, while others saw sizable gains.
- Student-population growth rate. The average annual population growth rate of persons under 15. In the short run, a falling (or growing) population of students will have little effect on a teacher’s job. In the long run, however, a larger population of students supports job security, as a district with more students will need more teachers.
- Per pupil spending. Teachers need to have the resources to do their jobs. This factor includes the 2012 spending per student for the largest district in each of the cities in our study.
- Math and reading testing percentile. Many teachers believe standardized tests are a poor way to measure student progress or teacher effectiveness. Nonetheless, such tests are widely used for both of those purposes. One result is that, in schools with low overall test scores, there is pressure on teachers to raise scores, while teachers in schools with high scores receive more praise and support. This factor includes the average national percentile in standardized math and reading tests for each city’s largest district.3
Try SmartAsset’s free Student Loan Calculator.
Methodology
To produce our final index, we ranked the 116 cities in our study across all five of the above factors. We then averaged those rankings, giving equal weight to each of the five factors, and applied a score on a scale of 0-100 based on the average ranking. The city with the highest average ranking (25.8) received a 100, while the city with the lowest average ranking (85.4) received a zero; a city with an average ranking halfway between the high and the low received a 50, and so on. The results, below, are the best and worst cities for teachers.
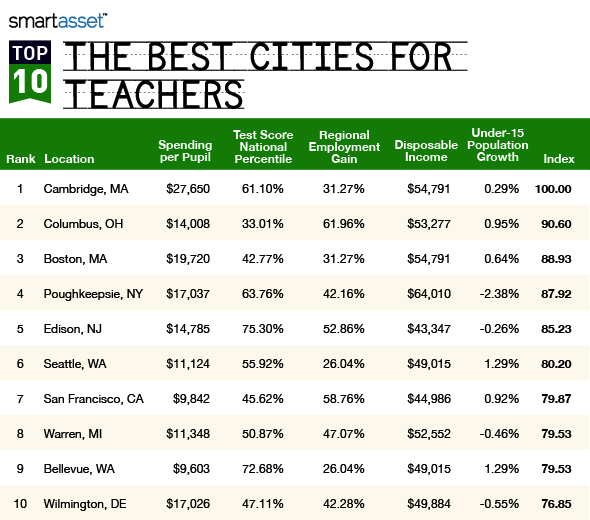
1. Cambridge, Massachusetts
Home to Harvard, M.I.T. and the thousands of current and future PhDs that work and study at those august institutions, Cambridge is a city that recognizes the importance of high quality education—and high quality educators. While Cambridge had an average ranking of 25.8 (out of 116) across the five factors we considered, its highest ranking was for district spending. With annual per pupil spending of $27,650, Cambridge School District ranked first overall in that category, so teachers in Cambridge can be sure to have the books and supplies they need to lead their classes effectively. That, along with the high disposable income enjoyed by teachers in the area and strong student test scores (8th highest overall), make Cambridge the most teacher-friendly city in America.
2. Columbus, Ohio
The largest city in Ohio is also among the best destinations for teachers. The Columbus metro area ranked in the top 25 for both hiring and student-population growth, and the Columbus City School District ranked 25th for per pupil spending, with the district spending an average of $14,008 for each student it educates, according to the U.S. Census Bureau.
Find out now: How does my 401(k) work?
3. Boston, Massachusetts
Across the Charles River from the top ranked city in our study, Boston likewise benefits from a strong academic culture. Boston University is the city’s fourth largest employer, and Northeastern University, Boston College and U-Mass Boston also have campuses in the city. As a result, the city places a strong emphasis on education: the Boston School District’s per student spending of $19,720 was sixth overall in that category, and teachers in the Boston-Cambridge-Quincy metropolitan area enjoyed the 22nd highest disposable income of any city in our study.
4. Poughkeepsie, New York
The smallest city to make the top ten, and one of the smallest in our study, Poughkeepsie may be the perfect place for teachers who don’t want to live in a big city. Teachers in the Poughkeepsie metropolitan area have an average disposable income of over $64,000 – highest in our study. The Arlington Central School District, which is the largest district in the area, spent an average of $17,037 per student, 14th highest overall (the smaller Poughkeepsie City School District fared even better, with per pupil spending of over $19,000).
5. Edison, New Jersey
In 1954, the township of Raritan renamed itself after its most famous son, Thomas Edison, inventor par excellence, who did much of his tinkering in Raritan’s Menlo Park neighborhood. Today, students in Edison Township seem to be intent on emulating The Wizard of Menlo Park: the Edison Township School District had the highest average math and reading test scores of any city we examined.
6. Seattle, Washington
The top-ranked west coast city in our study, Seattle rated in the top 50 in four of the five factors we considered. It was in the top half of cities for per pupil spending, district test scores, average disposable income and student-population growth. Seattle is also home to one the country’s best high school jazz bands: the Garfield High School Jazz Band has won the Essentially Ellington National Jazz Band Competition four out of the past twelve years, and placed second twice.
7. Warren, Michigan
One of just two cities in the top ten not located on either the east or west coast, Warren rated especially well for teacher employment growth. It was 19th overall in that factor, with the Warren-Troy-Farmington Hills metro area adding over 5,000 teachers since 2011, according to the Bureau of Labor Statistics.
8. San Francisco, California
Teachers who are looking to move to the Bay Area should have little trouble finding a job there in future years. The San Francisco-San Mateo-Redwood metro area had the ninth highest rate of teacher employment growth of the cities we examined, and the 17th highest rate of student population growth.
9. Bellevue, Washington
Across Lake Washington from 6th ranked Seattle, Bellevue routinely receives accolades for its high quality schools. Unsurprisingly, the Bellevue School District had the second highest math and reading test score average of the cities in our study.
10. Wilmington, Delaware
The 10th best city for teachers, Wilmington rated 15th overall for per pupil spending. On average, the Christina School District (named for the river that passes through Wilmington), spends just over $17,000 per student, according to the U.S. Census Bureau.
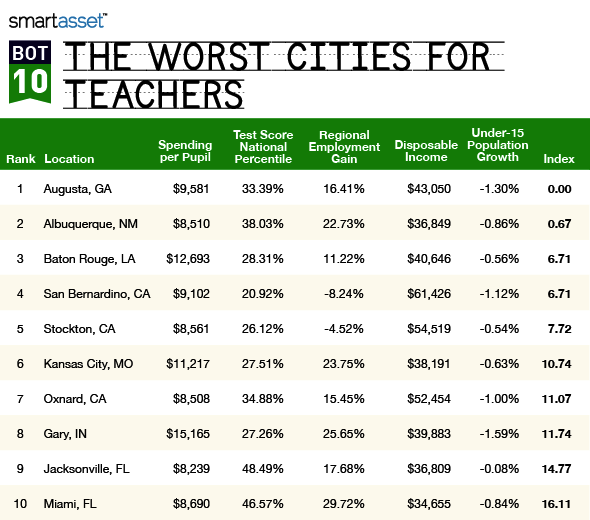
1. Augusta, Georgia
With an average ranking of 85th across the five categories we considered, Augusta, Georgia was the least teacher-friendly city in our study. The Augusta metro area is especially notable for its low rates of teacher-employment growth and student-population growth. It rated 97th and 107th respectively in those two categories.
2. Albuquerque, New Mexico
Teachers in the Albuquerque metro area were among the most poorly paid of any city in our study. On average, they made $45,165 as of 2013, but when factoring for the cost of housing in Albuquerque, disposable income for a typical teacher could be as low as $36,800.
3. San Bernardino, California
The results for San Bernardino are in some ways contradictory. On the one hand, teachers in the Riverside-San Bernardino metropolitan are among the most highly paid in the country, with an average disposable income of over $60,000. On the other hand, the area has actually been losing teachers in the past few years: teacher employment fell by over 8% from 2011 to 2013, the third highest rate of employment loss of any area in our study.
4. Baton Rouge, Louisiana
In the most recent district report card released by the Louisiana Department of Education, Baton Rouge had more failing schools (16) than schools receiving an A (11). As a whole, the East Baton Rouge Parish School District averaged a C grade, lower than the state average B. One potential avenue for improvement is higher teacher pay: teachers in Baton Rouge make an average of $49,238, and their disposable income ranked 93rd out of the 116 cities in our study.
5. Stockton, California
The 2012 municipal bankruptcy filing in Stockton has forced the city to make cuts in many parts of its budget, and the area’s teachers have not escaped the repercussions. According to the Bureau of Labor Statistics, the number of teachers employed in the Stockton metro area fell by over 4% from 2011 to 2013.
6. Kansas City, Missouri
Kansas City rated in the bottom 50 for four of the five categories in our study. Teachers in the Kansas City metro area have the 9th lowest average disposable income of any city in our study, and the Kansas City School District had the 9th lowest average score on math and reading tests.
7. Oxnard, California
Though Oxnard resides in one of the wealthier parts of the country, its teachers and students have by-and-large missed out on the benefits of that wealth. Per student spending is just $8,508 in Oxnard, according to the U.S. Census Bureau, 24th lowest of any city in our study.
8. Gary, Indiana
An industrial town located on the southernmost shores of Lake Michigan, Gary’s population has fallen by over 50% since the 1960s. More relevant to our study, however is what’s happened to the under-15 population, which has fallen 1.5% annually in recent years. This trend may limit long-term job prospects for the city’s teachers.
9. Jacksonville, Florida
The most populous city in Florida (though not the most populous metro area) Jacksonville rated especially poorly for teacher pay and spending per student. It ranked 104th and 96th respectively in those two categories.
10. Miami, Florida
Like those in Jacksonville, teachers in Miami are not particularly well-paid. Disposable income for a typical teacher in the greater Miami area is around $34,600, 7th lowest of any city we examined.
Photo credit: flickr
1. According to the Bureau of Labor Statistics, there were 640,000 police officers, 623,000 physicians, 601,000 therapists, 593,000 lawyers, 591,000 social workers and 501,000 postal workers working in the United States in 2013.
2. Survey data from the MetLife Survey of the American Teacher, conducted by Harris Interactive, available at metlife.com/teachersurvey.
3. Data on average teacher income and employment came from the Bureau of Labor Statistics Occupational Employment Survey. Data on median rent (used to calculate disposable income) came from the Department of Housing and Urban Development. Data on the student population growth rate came from the U.S. Census Bureau’s American Community Survey and data on district-level spending per student came from the Census’s survey of school system finances. Data on district test scores came from the Bush Institute’s Global Report Card, available at globalreportcard.org.