 Written by
Renewable energy has been gaining steam in recent years. Windmills are popping up on ridges and in fields throughout the country, and solar panels are covering more roofs every day. From 2008 to 2013, the total energy produced by renewable sources increased by more than 25%, according to data from the Energy Information Administration.
Try SmartAsset’s federal income tax calculator.
The reasons for this surge are two-fold. First and foremost are the basic economics. The cost of renewables – especially solar – have plummeted in recent years, meaning that renewable energy is now financially competitive with traditional power sources like coal and natural gas. Just as important, however, are the environmental considerations. Unlike those traditional power sources, renewables make a negligible contribution to carbon emissions, the key driver of climate change.
Much of the progress being made in renewable energy is happening at the state level. State incentives such as tax credits for solar installments have powered the uptick in renewables. Some areas have exploited built-in advantages like the steady winds of the Great Plains or the ample sunshine of the southwest. So which states are leading the renewable revolution?
To answer that question, SmartAsset looked at data on state-level renewable energy generation, carbon emissions and solar incentives. In addition to current production and policies, we looked at the change over the past five years, giving added credit to states that have shown marked improvement in renewables during that time. (Read our full methodology below.)
What you should know about claiming a renewable energy tax credit.
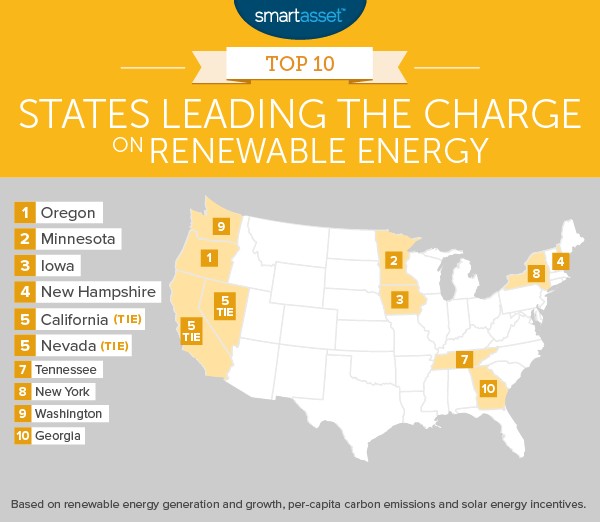
Key Trends
- West Coast power. Oregon, California and Washington State all ranked in the top 10 for their renewable energy policies and practices. These states have some built-in advantages (such as abundant hydroelectric power) but have also implemented policies to push renewables further than that.
- Midwest wind. Iowa and Minnesota ranked among the top five states for renewables. They are two of several Midwest states that have seen double-digit growth in total renewable output recently. Others include South Dakota, Kansas and Illinois.
- Carbon falling. Per-capita carbon emissions in the United States fell by more than 10% between 2008 and 2013. Just three states saw increases in per-capita carbon emissions over that period.
1. Oregon
Renewable energy in Oregon starts with hydroelectric power, which produced 2,067 gigawatt hours (GWh) of power in the state in 2015. That’s about 44% of the state’s total output. Hydroelectric is not the only renewable source that has powered Oregon into the top spot, however.
The Beaver State has tripled its wind energy capacity since 2008, with electricity produced by wind turbines now providing more than 12% of the state’s total production. Likewise, despite the fact that much of the population lives in the often-cloudy Willamette Valley, Oregon ranks fourth in the U.S. for its solar incentives and policies, according to SolarPowerRocks.com. Oregon taxpayers can claim a state credit of up to $6,000 ($1,500 per year) on their Oregon income tax returns for any solar investments.
2. Minnesota
A drive across Minnesota is sure to feature a wind turbine sighting — or twenty. According to the American Wind Energy Association, the state is home to 2,156 wind turbines, producing enough energy to power 831,000 homes. Overall, renewable output in Minnesota increased by 37% between 2008 and 2013. Over that same period, carbon emissions per capita fell by 14%.
3. Iowa
Iowa is the nation’s leader in not just one but two sources of renewable energy. The first is wind. The Hawkeye State got more than 28% of its electricity from wind in 2014. At 3,444 megawatts, it has the third highest wind capacity in the country, behind only California and Texas.
Iowa is also the country’s leading producer of ethanol fuel, which in the United States is largely derived from corn. The environmental benefits of corn-based ethanol are mixed, as production of the fuel can be fairly energy-intensive.
4. New Hampshire
Per-capita carbon emissions fell by 25% in New Hampshire from 2008 to 2013, the second largest emissions decline in the U.S. One of the factors driving that decline was the passage of a renewable portfolio standard in 2007, which requires electricity providers to amp up the amount of power they get from renewables, reaching 24.8% by 2025. Overall, renewable output in New Hampshire increased by 30% from 2008 to 2013.
5 (tie). California
Perhaps more than any other state, California has the opportunity to truly set the tone for renewable energy policies and investments across the United States, thanks to its large population and diverse landscape.
The state has done just that. In 2012, California passed a cap-and-trade program to reduce carbon emissions, the first such policy in the U.S. It has more than doubled the capacity of its wind farms since 2008. Growth in solar power has been even faster. The state had solar capacity of 475 megawatts in 2010. In 2014, more than 4,000 megawatts of capacity were installed in California.
One factor holding California from a top overall rank? Tax incentives. There is currently no tax credit for renewable energy on the California income tax.
5 (tie). Nevada*
The desert southwest receives more sunlight than any other area in the United States, making it an obvious place for investments in solar power. Nevada has exploited that built-in advantage in recent years, increasing total renewable output by 78% from 2008 to 2013.
According to the Solar Energies Industry Association the state ranks fifth in the U.S. for its installed solar capacity. That will likely only continue to increase. A total of nearly $570 million was invested in Nevada solar installations in 2014, an increase of more than 400% as compared with 2013.
Moving to Nevada? Try SmartAsset’s free mortgage calculator.
7. Tennessee
The total output from renewable energy sources in Tennessee increased by 57% between 2008 and 2013. During that same period, per-capita carbon emissions fell by more than 23%, the fourth largest decline in the country. Hydroelectric power constitutes the bulk of Tennessee’s current renewable output, but solar has been growing rapidly in recent years.
8. New York
The state of New York is a leader in several of the categories we considered. It has the lowest per-capita carbon emissions of any U.S. state at 8.14 metric tons per person (as of 2013). That’s down 17% since 2008. One major reason for that low number is that over half of New York’s population lives in the New York City metro area, residents of which have very low carbon footprints.
New York is also a leader when it comes to solar energy. SolarPowerRocks.com ranked the Empire State first in the nation for its solar policies and practices. Among those is a tax credit worth 25% of solar installation cost up to $5,000 on a homeowner’s New York state tax return.
9. Washington
The largest producer of renewable energy in the U.S., Washington State receives a significant portion of its electricity from hydroelectric plants like the Grand Coulee Dam, the nation’s largest hydroelectric power plant, with a capacity of 6,809 megawatts – more than three times the capacity of the Hoover Dam.
In addition to hydroelectric, Washington has been investing heavily in wind energy in recent years. There are more than 1,700 turbines statewide, many of them in the Columbia River Gorge, which acts as a wind tunnel.
10. Georgia
No state has reduced its carbon emissions in recent years more than Georgia. The state’s per capita emissions fell by 26% from 2008 to 2013. Georgia is one of the national leaders in biomass electricity generation, ranking third in the nation for its net electricity generation from biomass, according to the Energy Information Administration.
Data and Methodology
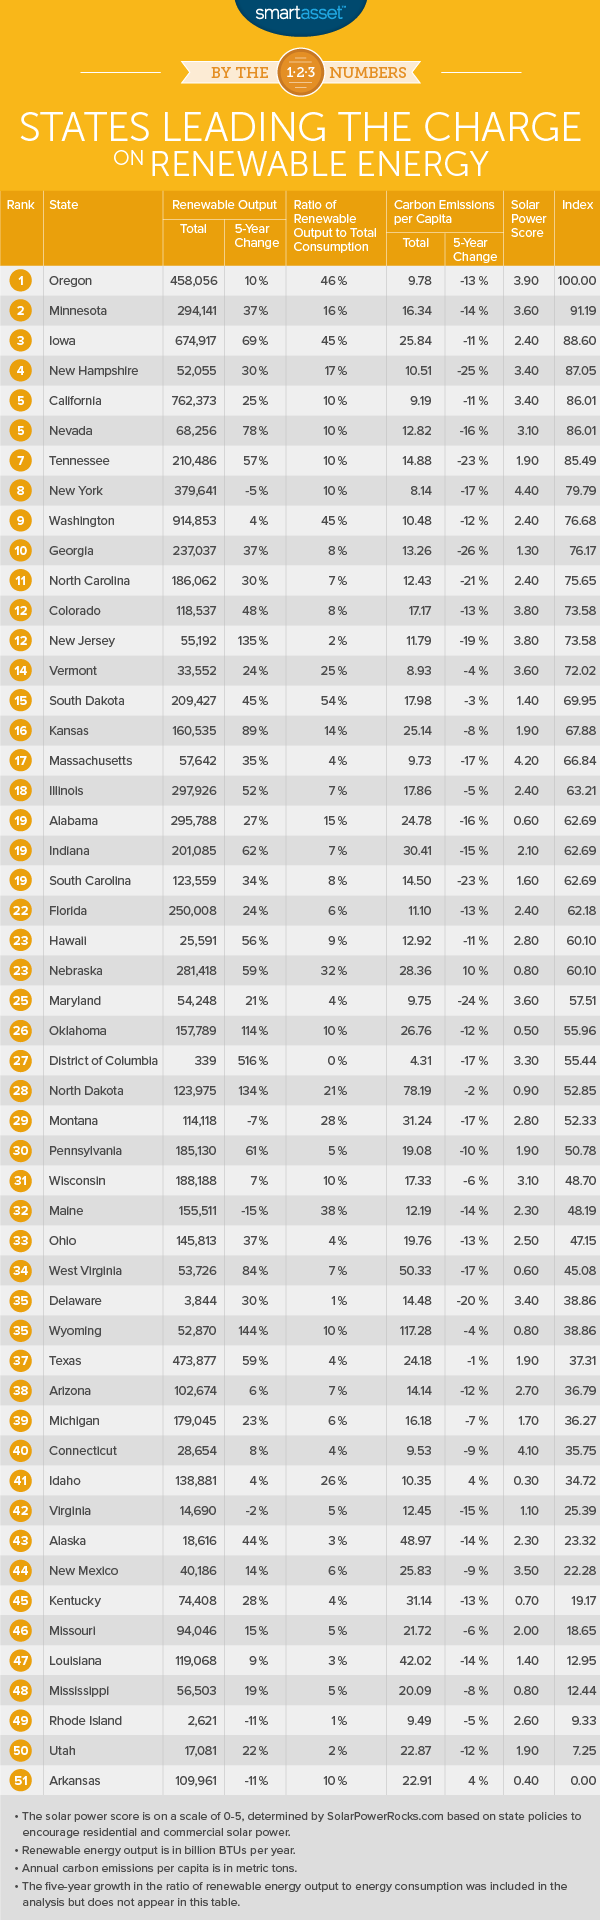
SmartAsset’s analysis incorporated seven different metrics of renewable energy production, renewable growth and state incentives to encourage renewables. We looked at the current state of renewable energy across all 50 states (and DC), as well as the trends in renewable energy. The metrics we considered are:
- Total energy output from renewables.
- Five-year percentage change in output.
- Current ratio of renewable output to total energy consumption.
- Five-year percentage change in that ratio.
- Current per-capita carbon emissions.
- Five year change in per-capita carbon emissions.
- Solar power score, measuring state incentives and policies for solar investment.
We ranked every state across each of those seven metrics. We then averaged those rankings, weighting each metric equally. Lastly, we assigned a score ranging from 0 to 100 based on that average. The state with the worst average scored a 0, while the state with the best average scored a 100.
Data on energy output, energy consumption and carbon emissions comes from the Energy Information Administration for the year 2013 (the most recent year for which data is available in all states). Five-year change data is based on the period from 2008-2013. The solar power score comes from SolarPowerRocks.com, which analyze a variety of state laws and policies to arrive at the scores.
* The Nevada public utility commission recently enacted a rule change that allows the state’s only power company to charge fees to homeowners with their own solar installations. The rule could lead to significant declines in solar investment in coming years. If it stands, expect Nevada to slip from the top of these rankings. In Nevada and other states, renewable energy is a young industry and political shifts and decisions can quickly change the dynamic that surrounds it.
Photo credit: ©iStock.com/ckaseberg