 Written by
In order to know how much you need to save for retirement you need to have a good estimate for how much you will be spending. But predicting how much you are going to be spending in retirement is difficult. Some retirees downsize their homes or move to a city with lower costs of living. But how much will that save? Your healthcare spending will likely increase in retirement, so that’s a higher expense you’ll need to account for. SmartAsset takes a look at these and other categories to find how spending changes in retirement.
SmartAsset focused on the 14 core categories found in the Bureau of Labor Statistics Consumer Expenditure Survey. We compared spending for working households households (those under the age of 65) to spending for over retired households (those 65 or over) in each of the 14 categories. Check out our data and methodology below to see where we got our data and how we put it together.
Key Findings
- Large drop in spending – In total, our data shows the average retired household spends $15,200, or 25%, less than the average working household.
- Retirees cut spending in most categories but spend more in some – Across the 14 major categories we analyzed, spending decreased in 11 of them. The major areas where retired households save are in housing and transportation. Healthcare spending on the other hand increases by nearly 44%.
- Retirement expenses within range for most Americans – The average retired household spends $45,756 each year. As of 2016, the median household income in the US was $57,600, according to the Census Bureau so cutting expenses in retirement to $45,700 seems reasonable for most Americans.
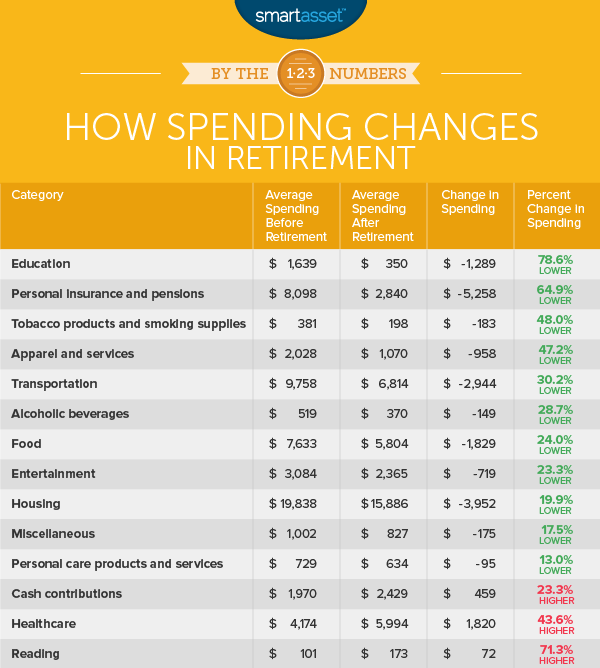
1. Education
The average working household spends around $1,600 per year on education. In retirement that number drops dramatically to $350, a percent change of just under 79%.
This metric tracks spending in all education-related categories from spending on elementary school through college. However, this category only includes spending on education for members of the household and does not include spending on education for members outside of the household. If a retired household were to help pay for their grandchildren’s college for example, it would fall under the cash contributions category which is ranked below.
2. Personal insurance and pensions
According to our data the average under-65 household spends nearly $8,100 per year in this category. After retirement, spending in that category drops to $2,840. Specifically, this category tracks spending toward retirement programs, including Social Security and private retirement accounts.
3. Tobacco products and smoking supplies
According to CDC data, Americans over the age of 65 are the least likely to smoke, with only 9% of seniors reported to smoke. That is not only good news for their lungs but also their budgets. Tobacco products can be expensive especially when so-called sin taxes are tacked on.
According to our data, spending on tobacco products and smoking supplies is $183 lower in retired households than in working households. That is roughly a drop of 48%. Although with a difference of only $183 per year it is unlikely spending on tobacco products will be the difference between a secure retirement and a working retirement.
4. Apparel and services
Retired households are thriftier shoppers according to our data. Bureau of Labor Statistics data shows the average retired household spends 47% less on apparel and services than the average working household. There are some caveats however. A large chunk of the drop-in spending in this category comes in spending on apparel and services for children. Spending on children under 2 drops by $62 per year, spending on boys ages 2 and 15 drops by $96 per year and spending on girls ages of 2 and 15 drops by $82 per year.
Where spending changes the least is spending on clothes for women aged 16 or over. Working households spend around $615 per year and retired households spend $430 per year – a drop of only 30%.
5. Transportation
Transportation ranks fifth for percent change in spending. In dollar terms it represents the third-highest category for total savings. Our data shows the average working household spends nearly $9,800 per year on transportation while the average retired household spends $6,800. That is a percent drop of 30% but also a savings of $3,000 per year.
The biggest saving for retired households in this category comes in vehicle purchases. Senior households spend around $1,300 or 30% less than working households on vehicle purchases. However, they spend an almost identical amount on new cars and trucks. The biggest difference comes in used cars and trucks. Perhaps with an eye on dependability, retired households spend 55% less than working households on used cars and trucks.
6. Alcoholic beverages
You may expect that with more time and less obligations, retired households might spend more on alcoholic beverages than working households. That notion it turns out is incorrect. On average retired households spend about $370 per year on alcohol while working households spend about $519 on alcoholic beverages.
7. Food
According to our data when retirees need to trim the fat they look to their eating habits. On average, retired households cut their food budgets by about 25% compared to working households.
While every category takes a hit, the biggest savings for retirees comes from eating out less. In total spending on food away from home is 35% less for retired households compared to working households.
8. Entertainment
Spending on entertainment drops by about the same amount as spending on food: 23%. In terms of dollars, our data shows that retired households spend about $720 per year less than working households on entertainment.
Spending on live events and toys falls in retirement by the widest margin. In both of those subcategories total spending falls by over 36% between working households and retired households.
9. Housing
Housing is where retirees save the most money. Retired households spend about 20% less than working households on housing. That equals savings of nearly $4,000 per year.
10. Miscellaneous
This category includes spending on a wide range of things from funerals to savings account fees to union dues to legal fees.
The difference in spending between working and retired households in this category is small. Overall over-65 households spend about $175 less in this category per year than working households.
11. Personal care products and services
On average retired households and working households spend similar amounts when it comes to personal care. According to our data, retired households spend about $100 less than working households on personal care products and services.
12. Cash contributions
Spending in this category goes to any money sent outside the consumer unit. That can mean alimony payments, child support or support for children away from home among other things.
Retired households spend about $2,400 on items in this category compared to just under $2,000 for working households.
13. Healthcare
As you age, your health tends to worsen. So it makes sense that older households spend more on their healthcare than younger households. Retired households, according to our data, spend about $1,820, or 43%, more on health care than non-senior households.
Spending across all healthcare subcategories goes up in retirement but spending on health insurance and drugs make up the largest portion of the rise in spending.
14. Reading
Within this category the Bureau of Labor Statistics tracks spending on reading as a hobby. That means it includes spending on newspaper and magazine subscriptions, books and e-books and encyclopedias and other reference books. It does not however include spending on textbooks, which fall under the education category.
Retired households spend more on reading materials than working households, although not by much. The two groups are separated by only $72.
Data and Methodology
In order to find how spending changes in retirement we looked at data on all 14 major categories from the Bureau of Labor Statistics Consumer Expenditure Survey. To create our rankings, we looked at the percent change in spending in every category for households under the age of 65 compared to households over the age of 65. We ranked the categories from largest to smallest in descending order.
Data for all figures comes from the Bureau of Labor Statistics’ Consumer Expenditure Survey and is for 2016.
Tips for Saving for Retirement
- Take advantage of employer 401(k) matching – Many employers offer 401(k) matching, and it is one of the best ways to boost your retirement savings. Typically the way 401(k) matching works is your employer will match a percentage of your 401(k) contributions up to a percent of your gross salary. This is basically free money so you should take full advantage of it.
- Consider working with a financial advisor – In addition to maximizing your savings you want to make sure your money is in the right hands. A financial advisor can make sure you get the most value out of your investments.
Questions about our study? Contact us at press@smartasset.com
Photo credit: ©iStock.com/PeopleImages