 Written by
Some places are more family friendly than others. When deciding where to take out a mortgage and raise your children, it is important to consider not only an area’s cost of living, but also the benefits an area can provide in terms of education, health and entertainment.
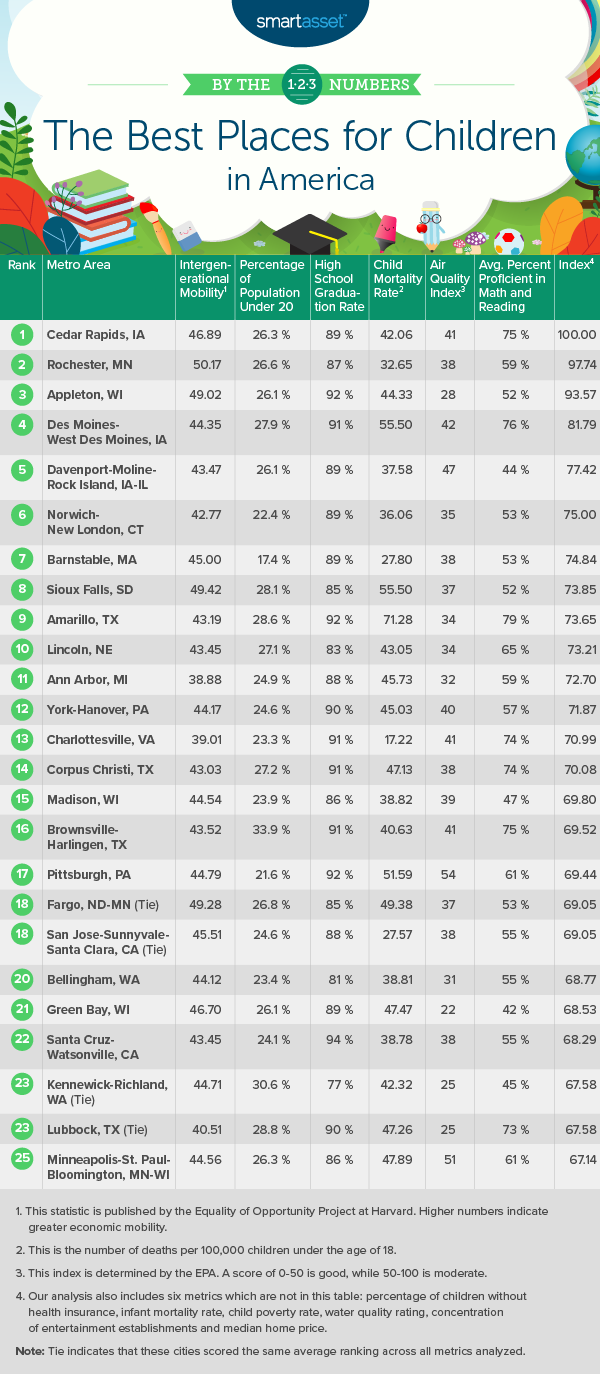
In order to determine some of the best places in the U.S. for children, we looked at data for 194 metro areas across 13 metrics, spanning a range of topics like affordability, entertainment, school quality and environment. Check out the Data and Methodology section below for more information on our data sources and how we put together our final rankings.
This is SmartAsset’s fifth annual study on the best places for children. Check out the 2018 version of the study here.
Key Findings
- A consistent top three. The top three metro areas on our 2019 list are the same as those in our 2018 and 2017 studies. They include Cedar Rapids, Iowa; Rochester, Minnesota and Appleton, Wisconsin.
- Iowa stubborn. Of the top five best places for children in 2019, Iowa doggedly has three metro area representatives. They are Cedar Rapids and Des Moines-West Des Moines, as well as Davenport-Moline-Rock Island, which falls between Iowa and Illinois.
- A lagging South. The South does not rank well relative to other U.S. regions. Eight of the 10 metro areas in our bottom 10 are in the South. By state, Florida appears twice and Georgia four times along with Alabama and North Carolina each once.
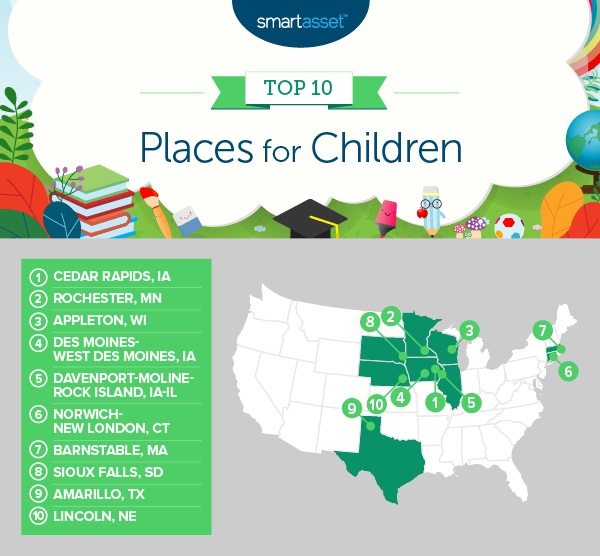
1. Cedar Rapids, IA
Ranked as the best place for children in America every year we have conducted this study, Cedar Rapids, Iowa remains in first place for 2019. The Cedar Rapids area does well across all 13 metrics we considered, and scores in the top half of the study for all but one of them. Cedar Rapids ranks particularly well according to our data on education. For the 2016-2017 school year, roughly 75% of students were proficient in English and math. What’s more, Cedar Rapids is in the top third of all metro areas in our study for the metric of high school graduation rate. In 2016-2017, almost 90% of students graduated.
In addition to offering broad educational opportunities, the Cedar Rapids area has a wide variety of entertainment options for children, ranking in the top 10% of metro areas for number of children’s entertainment establishments as a percentage of all businesses. Using the U.S. Census Bureau’s 2016 Metro Area Business Patterns Survey, we estimate that 0.26% of companies in the area are children’s entertainment establishments.
2. Rochester, MN
Rochester, Minnesota ousted Appleton, Wisconsin for the No. 2 spot this year and ranks first across all 194 metro areas in our study for intergenerational mobility, according to data from Harvard’s Opportunity Insights. Rochester has an absolute upward mobility score of 50. This means that for children of parents who are at or below the 25th percentile of the national income distribution, children are expected to rank in the 50th percentile as adults.
Cited as a concern last year, the median home value in Rochester remains relatively high. According to Census Bureau estimates, the median home value in Rochester was $212,200 in 2017, putting it in the bottom half of metro areas in terms of housing costs.
3. Appleton, WI
Appleton, Wisconsin comes in third place and has a similar profile to that of Rochester, Minnesota. It ranks particularly well in terms of education and intergenerational mobility. The high school graduation rate is the highest of any places in our top 10 with almost 92% of students graduating. Appleton has an absolute upward mobility score of 49, a top-five rate.
Moreover, housing in Appleton is relatively more affordable than in Rochester. In 2017, the median home value was $168,300, almost $44,000 less than the median home value in Rochester.
4. Des Moines- West Des Moines, IA
Des Moines-West Des Moines, Iowa moved up to fourth place this year from sixth in 2018. It offers reasonable home values along with impressive education statistics. For the 2016-2017 school year, almost 91% of students graduated from high school and roughly 76% of students were proficient in English and math.
Des Moines-West Des Moines, compared to the other metro areas in our top 10, falls a bit short on our statistics regarding the environment. For 2018-2019, Des Moines-West Des Moines had a median air quality index of 42. While according to the EPA a score of 0-50 is good, this score is still the second-highest in our top 10 and ranks 119th overall. Additionally, in 2019, almost 29% of households had a water quality violation, a bottom-10 rate.
5. Davenport-Moline-Rock Island, IA-IL
Davenport-Moline-Rock Island, otherwise known as the Quad Cities metropolitan area spanning Iowa and Illinois, jumped up significantly from our 2018 ranking. The move was primarily a result of a significant improvement in the child poverty rate. In our 2018 study, Davenport-Moline-Rock Island ranked in the bottom quartile of metro areas according to the child poverty rate. However, according to U.S. Census Bureau data, the child poverty rate decreased from approximately 24% in 2016 to approximately 17% in 2017.
Despite the decrease in child poverty rates, Davenport-Moline-Rock Island continues to underperform in terms of education. According to data from the U.S. Department of Education, only approximately 42% and approximately 44% of students were proficient in English and math, respectively, for the 2015-2016 school year. For the 2016-2017 school year, the statistics are similar. Only 42.97% of students were proficient in English and 44.83% were proficient in math.
6. Norwich- New London, CT
One of two metro areas in the Northeast in our top 10, Norwich-New London, Connecticut is making a repeat appearance on our list and has a slightly older population than most of the other metro areas. The percentage of the population under the age of 20 is roughly 22% as compared to an average of almost 26% across all metro areas studied.
Although there are fewer children as a percentage of the population, Norwich-New London has a lot to offer in terms of education and health benefits. The metro area ranks in the top half of our study for percentage of students proficient in English as well as percentage proficient in math, and it ranks 56th out of 194 total metro areas for its graduation rate, which is approximately 89%.
7. Barnstable, MA
Barnstable, Massachusetts is the metro area in our top 10 with the most expensive housing. According to Census Bureau estimates, the median home value in Barnstable was $401,100 in 2017 compared to an average median home value of $222,790 across all 194 metro areas in our study.
However, despite the cost, Barnstable is a particularly fun place for kids. More than a third of all companies in Barnstable are children’s entertainment establishments, a top-three rate. Barnstable also has the seventh-lowest child poverty rate in the study at 9% and the third-lowest and seventh-lowest infant and child mortality rates, respectively.
8. Sioux Falls, SD
Sioux Falls, the most populous locale in South Dakota, comes in eighth in our study. Notably, Sioux Falls has the lowest child poverty rate of any of the 194 metro areas we studied, with less than 7% of children falling below the poverty line. By comparison, the average child poverty rate across all 194 metro areas is approximately 19%. Sioux Falls also has a high intergenerational mobility score, ranking second behind Rochester, Minnesota.
The lowest ranking Sioux Falls received across all factors is for graduation rate. For the 2016-2017 school year, approximately 15% of students did not from graduate high school.
9. Amarillo, TX
Located in Texas’ panhandle, Amarillo is the only place in our top 10 located in the South. Amarillo offers an impressive combination of housing affordability and access to educational opportunities. According to Census Bureau estimates, the median home value in Amarillo is $139,900. Children in Amarillo perform well academically. For the 2016-2017 school year, 83.27% of students were proficient in English and 73.87% of students were proficient in math, meaning that Amarillo ranked first and ninth overall in those metrics respectively.
Amarillo falls relatively short on health-related statistics, however. It ranked in the bottom quartile of all metro areas for infant and child mortality rates, as well as the percentage of children without health insurance. Almost 10% of the population under 19 does not have health insurance.
10. Lincoln, NE
In 2017, the median home value in Lincoln, Nebraska was $178,600. Students in Lincoln also perform relatively well in the subjects of English and math, with 72.99% of students proficient in English and 57.62% of students proficient in math, both of which rank in the top half of our study. However, somewhat surprisingly, the high school graduation rate for Lincoln is relatively low. In fact, ranking 155th for this metric out of all 194 metro areas in our study, Lincoln has the lowest high school graduation rate of any metro area in our top 10. For the 2016-2017 school year, almost 17% of students did not graduate high school.
Data and Methodology
To find the best places for children, SmartAsset analyzed data on 194 metro areas. Specifically, we compared metro areas across the following 13 metrics:
- Children’s entertainment establishments. This is a measure of the percentage of children’s entertainment establishments relative to all companies in each metro area. Children’s entertainment establishments include bowling alleys, zoos, sports teams, arcades, museums and theme parks. Data comes from the U.S. Census Bureau’s 2016 Metro Area Business Patterns Survey.
- Median home value. Data comes from the U.S. Census Bureau’s 2017 1-year American Community Survey.
- High school graduation rate. Data comes from the U.S. Department of Education EDFacts for the 2016-2017 school year
- Percentage of students proficient in English. This is the average percentage of students across schools who are proficient in reading. Data comes from the U.S. Department of Education EDFacts for the 2016-2017 school year. It is measured by metro area.
- Percentage of students proficient in math. This is the average percentage of students across schools who are proficient in math. Data comes from the U.S. Department of Education EDFacts for the 2016-2017 school year. It is measured by metro area.
- Child poverty rate. This is the percentage of residents under the age of 18 who are living below the poverty line. Data comes from the U.S. Census Bureau’s 2017 1-year American Community Survey.
- Percent of population who are children. This is the percentage of residents under the age of 20. Data comes from the U.S. Census Bureau’s 2017 1-year American Community Survey.
- Median air quality index. Data comes from the Environmental Protection Agency and is for 2018 and 2019.
- Absolute upward mobility. This measures the percentile of the national income distribution into which someone born into the bottom quartile of society is expected to move. Data comes from Harvard’s Opportunity Insights.
- Water quality. This is the percentage of families who had a water quality violation. Data comes from countyhealthranking.com and is for 2019.
- Infant mortality rate. This is the number of deaths among children under one year old per 1,000 live births. Data is from countyhealthranking.com for 2019.
- Child mortality rate. This is the number of deaths among children under age 18 per 1,000 live births. Data is from countyhealthranking.com for 2019.
- Percentage of children without health insurance. This is the percentage of the population under 19 without health insurance. Data is from the U.S. Census Bureau’s 2017 1-year American Community Survey.
First, we ranked each metro area in every metric, giving half a weight to air quality and water quality, and a full weight to the other factors. Then we found each area’s average ranking and used the average to determine a final score. The metro area with the best average ranking received a score of 100. The metro area with the lowest average ranking received a score of 0.
Tips for Finding a Home
- Make sure you can handle a mortgage. A mortgage is a big commitment, so be certain you’ll be able to afford whatever you’ll end up having to pay. Use SmartAsset’s mortgage calculator to see the ideal range in which you should be shopping.
- Trusted personal finance advice. A financial advisor can help you make smarter financial decisions such as moving or starting a 529 savings plan for anyone you intend to support through college. Finding the right financial advisor that fits your needs doesn’t have to be hard. SmartAsset’s free tool matches you with financial advisors in your area in five minutes. If you’re ready to be matched with local advisors that will help you achieve your financial goals, get started now.
Questions about our study? Contact us at press@smartasset.com
Photo credit: ©iStock.com/FatCamera