 Written by
Since March, mortgage rates have fallen steadily. According to Freddie Mac data, the 30-year fixed-rate average was at 2.90% and the 15-year fixed-rate average stood at 2.40% for the week ending September 24, 2020. These rates are 0.74 and 0.76 percentage points lower, respectively, than a year earlier. Over the same period, Americans have saved more: Bureau of Economic Analysis data shows that though the personal saving rate fell from its record 33.0% in April, the July 2020 personal saving rate of 17.8% is still 10.1 percentage points higher than last year.
With mortgage rates at all-time lows and Americans saving more than ever, now may be a good time for individuals and families considering homeownership to take a serious look at their options. Buying a home for the first time requires significant research and thought. Even after qualifying for a mortgage and covering the down payment and closing costs, first-time homeowners must consider their comprehensive financial situation and whether they will be able to make the monthly mortgage payments. First-time buyers may also want to consider certain city-specific factors such as entertainment options, commute times and job opportunities.
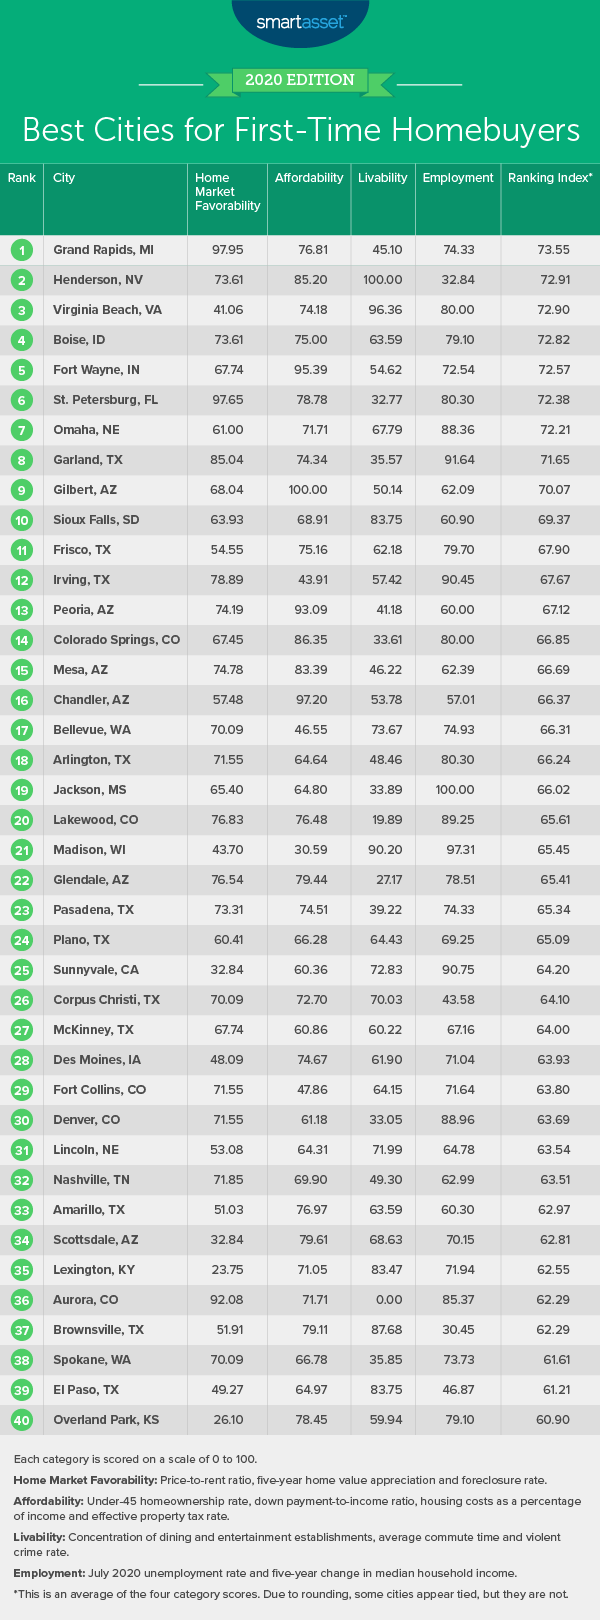
In this study, SmartAsset uncovered the best cities for first-time homebuyers in 2020. We compared 185 of the largest U.S. cities across 12 metrics. We grouped the metrics into four categories: home market favorability (price-to-rent ratio, five-year home value appreciation and foreclosure rate), affordability (under-45 homeownership rate, down payment-to-income ratio, housing costs as a percentage of income and effective property tax rate), livability (concentration of dining and entertainment establishments, average commute time and violent crime rate) and employment (unemployment rate and five-year change in median household income). For details on our data sources and how we put all the information together to create our final rankings, check out the Data and Methodology section below.
Key Findings
- The Northeast falls behind. No Northeast city ranks in our top 25 cities for first-time homebuyers. The highest-ranking Northeast city is Buffalo, New York, coming in at 43rd, followed by Pittsburgh, Pennsylvania at 64th. Both cities rank well in terms of home market favorability, but they fall behind in our employment category. Specifically, the July 2020 unemployment rate was more than 14% in both cities, and median household incomes grew by less than 16% between 2013 and 2018.
- About half of households under the age of 45 own their home or apartment. The 2018 national homeownership rate is about 64%, though that figure varies widely by age. The under-45 homeownership rate is more than 18 percentage points lower, at roughly 46%. Meanwhile, most older Americans own their homes. The homeownership rate for households between 45 and 64 is 71.81% while the over-65 homeownership rate is even higher, at 78.22%.
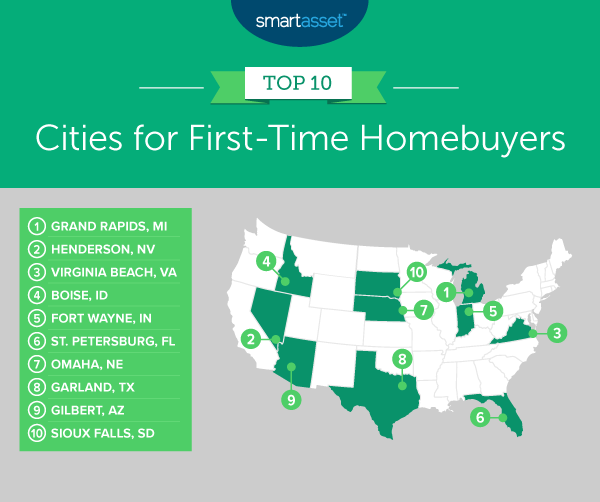
1. Grand Rapids, MI
Grand Rapids, Michigan ranks in the top fifth of cities for three of the four categories we considered: home market favorability, affordability and employment. It ranks particularly well for home market favorability, with the 42nd-best price-to-rent ratio (13.96) and 49th-highest five-year home value appreciation (53.52%). Additionally, the state of Michigan has the 15th-lowest foreclosure rate, at 0.25 per 10,000 homes. In the categories of affordability and employment, Grand Rapids ranks within the best 50 out of all 185 cities for four metrics: high under-45 homeownership rate (40.73%), low down payment-to-income ratio (0.60), low housing costs as a percentage of income (20.31%) and low July 2020 unemployment rate (8.7%).
2. Henderson, NV
A high percentage of young residents in Henderson, Nevada are homeowners. The city has the 24th-highest under-45 homeownership rate, at 46.34%. Henderson additionally ranks in the top 25 cities for three other metrics. It has the 16th-lowest effective property tax rate (0.56%), the 22nd-highest concentration of dining and entertainment establishments (almost 12%) and 20th-lowest violent crime rate (less than 200 per 100,000 residents).
3. Virginia Beach, VA
Virginia Beach, Virginia ranks particularly well in the categories of livability and employment. Dining and entertainment establishments make up more than 12% of establishments in the greater county. In 2018, the average commute time was less than 24 minutes, and there were fewer than 120 violent crimes per 100,000 residents. Regarding employment, Virginia Beach had the 28th-lowest July 2020 unemployment rate (7.8%) and the 72nd-highest five-year change in median household income (almost 23%) across all 185 cities in the study.
4. Boise, ID
First-time homebuyers might want to consider Boise, Idaho as a spot given the city’s high under-45 homeownership rate and strong performance across home market favorability metrics (i.e. price-to-rent ratio, five-year home value appreciation and foreclosure rate). Census Bureau data from 2018 shows that almost 46% of Boise households led by individuals younger than age 45 own their house or apartment. Across the home market favorability metrics we considered, Boise has the 24th-highest five-year home value appreciation (almost 65%) and the state of Idaho has the 24th-lowest foreclosure rate (about 0.31 per 10,000 homes).
5. Fort Wayne, IN
Fort Wayne, Indiana is a very affordable city for individuals or families looking to purchase a home for the first time. Median annual housing costs in the area make up only about 18% of the median household income. Additionally, the 2018 down payment-to-income ratio is 0.48, the 11th-best in our study. What’s more, many other young individuals have been able to move from renting to homeownership. The under-45 homeownership rate in Fort Wayne is 47.41%, almost two percentage points higher than the national average and the 21st-highest of all 185 cities in our study.
6. St. Petersburg, FL
St. Petersburg, Florida ranks as the No. 6 city for first-time homebuyers in our study. While the city falls a bit behind on the livability factors we considered, it ranks within the top 20 of the study for the other three categories of market favorability, affordability and employment. The home market in St. Petersburg is particularly favorable for individuals looking to buy. In 2018, the price-to-rent ratio was 16.25, the 61st-best in our study, and from 2013 to 2018, the median home value rose by more than 70%, the 16th-highest increase overall. Homeowners here also generally contend with lower monthly housing costs. Median annual housing costs for owners make up less than 22% of the city’s median household income.
7. Omaha, NE
Omaha, Nebraska ranks 31st for the category of livability and 11th for the category of employment. Regarding job opportunities, incomes are rising in the area and unemployment has remained relatively low during COVID-19. Between 2013 and 2018, the median household income in Omaha rose by almost 25%. As of July 2020, the area’s unemployment rate was less than 7%. It also has the 12th-lowest average commute time in the study (roughly 19 minutes).
8. Garland, TX
Garland, Texas ranks 13th for the category home market favorability and third in the category of employment. Census data from 2018 shows that the ratio between the median valued home and median annual rent in Garland was 12.62, the 27th-best in our study. Additionally, between 2013 and 2018, the median home value increased by about 56%, the fourth-highest increase of any city in our top 10 and 44th-highest overall. Regarding job opportunities, the July 2020 unemployment rate (8.1%) is the 35th-lowest and the five-year change in median household (almost 32%) is the 26th-highest. With incomes rising, individuals may be able to put more money toward their savings and potential down payment.
9. Gilbert, AZ
Gilbert, Arizona is the top-ranking city in the study for the affordability category. It has the highest under-45 homeownership rate (69.76%), the 63rd-lowest down payment-to-income ratio (0.70), the sixth-lowest housing costs as a percentage of income (19.25%) and 22nd-lowest effective property tax rate (0.60%) overall. Gilbert also ranks well in the category of home market favorability. Across all three metrics in that category – price-to-rent ratio, five-year home value appreciation and foreclosure rate – Gilbert ranks in the top half of cities.
10. Sioux Falls, SD
Sioux Falls, South Dakota ranks in the top third of the study for three of the four categories we considered. Specifically, it places 10th for livability, 45th for affordability and 58th for home market favorability. Across specific metrics, Sioux Falls has the second-lowest average commute time (less than 17 minutes) and the 13th-highest under-45 homeownership rate (about 53%) overall. The state of South Dakota has the fifth-lowest foreclosure rate overall, at 0.16 per 10,000 homes.
Sioux Falls ranks 80th in the category of employment. Though unemployment in Sioux Falls is currently low relative to other large U.S. cities and the national average, incomes have remained stagnant in the city over the past several years. Between 2013 and 2018, the median household income in Sioux Falls rose by less than 11%, unadjusted for inflation.
Data and Methodology
To find the best cities for first-time homebuyers, we looked at data on the 200 largest U.S. cities. Complete data was available for 185 of those cities. We compared the 185 cities across four categories:
- Home market favorability. For our home market favorability category, we considered the price-to-rent ratio, five-year home value appreciation and foreclosure rate. Data comes from the Census Bureau’s 2018 and 2013 1-Year American Community Surveys and realtytrac.com. It is important to note that foreclosure rate is reported at the state level.
- Affordability. Our affordability category includes the under-45 homeownership rate, down payment-to-income ratio, housing costs as a percentage of income and effective property tax rate. Data for all four metrics comes from the Census Bureau’s 1-Year American Community Survey.
- Livability. For our livability category, we considered the concentration of dining and entertainment establishments, average commute time and violent crime rate. Data on establishments and commuting comes from the Census Bureau’s 2018 County Business Patterns Survey and 2018 1-Year American Community Survey. Crime data comes from the FBI and is for 2018. The concentration of dining and entertainment establishments is reported at the county level.
- Employment. This includes the July 2020 unemployment rate and the five-year change in median household income. Data comes from the Bureau of Labor Statistics and the Census Bureau’s 2018 and 2013 1-Year American Community Surveys. Unemployment data is reported at the county level.
We ranked each city in every metric and found an average ranking and score for each category. We then calculated a final score by averaging the four category scores. The city with the highest cumulative score ranked at the top of our list, and vice versa.
Home Buying Tips for First-Timers
- Mortgage management. It is important to know when purchasing a home what you’ll be paying each month and for how long. To get a sense of what that might look like, check out SmartAsset’s free mortgage calculator.
- Buy or rent? Even if you have the savings to buy a first home, be sure the switch makes sense. If you are coming to a city and plan to stay for the long haul, buying may be the better option for you. On the other hand, if your stop in a new city will be a short one, you’ll likely want to rent. SmartAsset’s rent vs. buy calculator can help you see the cost differential between purchasing a home or apartment and renting.
- Seek out trusted advice. No matter where you live, a financial advisor can help you get your financial life in order. Finding the right financial advisor doesn’t have to be hard. SmartAsset’s free tool matches you with financial advisors in your area in five minutes. If you’re ready to be matched with local advisors that will help you achieve your financial goals, get started now.
Questions about our study? Contact us at press@smartasset.com
Photo credit: ©iStock.com/kali9