 Written by
Over the past 30 years, employment in science, technology, engineering and math (STEM) jobs has grown by almost 80%, according to a recent figure from Pew Research Center. However, there is still significant disparity in representation across gender lines and particularly racial ones: though Blacks and Hispanics combined accounted for more than a quarter (27%) of the 2016 U.S. workforce, Pew reports they totaled only 16% of the STEM workforce. Where people live, though, can be a factor in their access to companies that value a more heterogeneous group of employees. That’s why SmartAsset decided to find which cities are doing better than others when it comes to diversifying STEM workforces.
To find the best cities for diversity in STEM, we took a closer look at racial and gender breakdowns of workers in the 35 cities with the largest STEM workforces. For details on our data sources and how we put the information together to create our final rankings, check out the Data and Methodology section below.
This is SmartAsset’s fifth study on the best cities for diversity in STEM. Read the 2019 version here.
Key Findings
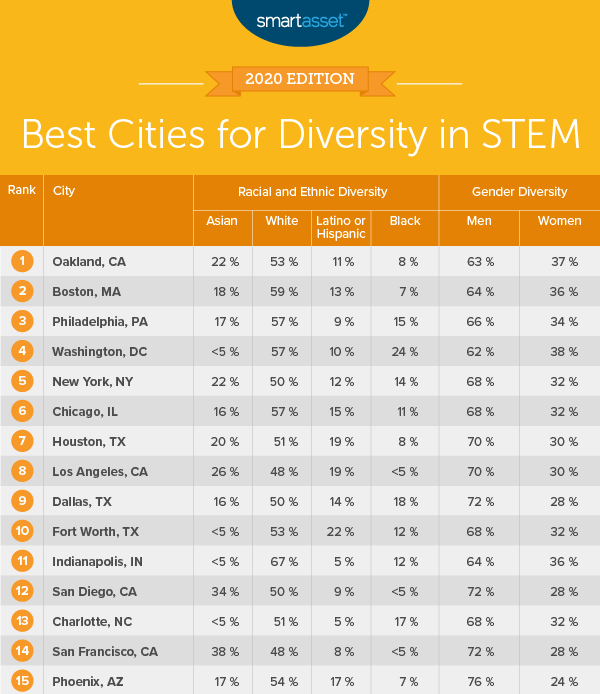
- New entrants to our list, including Oakland, California at No. 1. Some cities on this year’s list didn’t rank in the past, because their smaller STEM workforces meant the Census lacked sufficient demographic data. Oakland was not in the running in last year’s version of our study for that reason, but it takes first place this year, indicating a growing, diverse STEM workforce. Two other cities that were not in our rankings last year but do appear this year are Indianapolis, Indiana (at No. 11) and Colorado Springs, Colorado (at No. 35).
- White men still comprise a majority of the STEM workforce. In all 35 of the cities in our study, men comprise more than 60% of the STEM workforce. In terms of race/ethnicity, there are just 10 cities in which white workers comprise less than 50% of the STEM workforce and only three cities in which white workers comprise 25% or less of the STEM workforce: Sunnyvale, San Jose and Fremont in California.
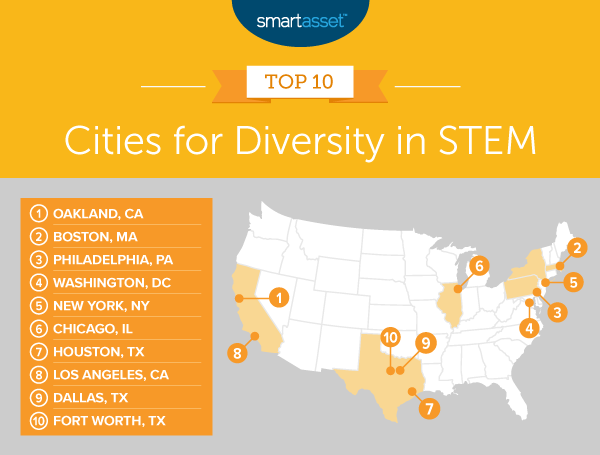
1. Oakland, CA
Oakland, California takes the No. 1 spot in our study. Even though the STEM workforce is almost 63% male, the city ranks second-best on our gender diversity index for STEM workers, just after Washington, D.C. In terms of racial makeup, Oakland’s race/ethnicity index is seventh-highest in the study. Black workers make up a little more than 8% of the STEM workforce, Asian workers make up about 22% and Hispanic or Latino workers make up more than 10%. White workers make up more than 52% of STEM workers.
2. Boston, MA
Boston, Massachusetts has the third-best gender diversity index across all 35 cities: Almost 64% of STEM workers are men, and a little more than 36% are women. In terms of race/ethnicity, white workers make up about 59% of all STEM workers, Black workers make up close to 7%, Asian workers close to 18% and Hispanic workers about 13%.
3. Philadelphia, PA
In Philadelphia, Pennsylvania, STEM workers total 38,000, two-thirds of whom are male and one-third of whom are female. White workers make up about 57% (about 21,800), Black workers make up a little more than 15% (roughly 5,700), Asian workers make up almost 17% (about 6,400) and Hispanic or Latino workers make up almost 9% (roughly 3,400).
4. Washington, DC
In Washington, D.C. the total number of workers in STEM amounts to about 49,100. The roughly 18,600 women in these jobs make up almost 38% of this total, and the more than 30,400 men make up roughly 62%. Despite this disparity, Washington ranks the best for gender diversity in our study.
In terms of race, Hispanic or Latino workers comprise almost 10% of STEM workers, Asian workers comprise less than 5% and Black workers make up more than 24% (which is the highest percentage for this demographic in the study). The remaining roughly 57% of STEM workers are white.
5. New York, NY
New York, New York has the highest number of workers in STEM across all 35 cities, at almost 215,700. Almost 68,700 women (about 32%) comprise this total, while more than 147,000 men (68%) do.
New York City ranks second best on racial/ethnic diversity in our study. About 108,800 of STEM workers in New York City, or about 50%, are white. Almost 14% are Black, about 29,500. More than 22% are Asian, almost 48,400. Hispanic and Latino workers in the field total about 12%, at about 26,300.
6. Chicago, IL
There are about 95,100 STEM workers in Chicago, Illinois. Of this total, about 68% are men and about 32% are women. More than 57% of STEM workers in Chicago are white, about 11% are Black, almost 16% are Asian and close to 15% workers are Hispanic or Latino.
7. Houston, TX
The total number of STEM workers in Houston, Texas exceeds 79,500. Almost 70% of the total STEM workers there are men, and more than 30% are women. Houston has the third-best race/ethnicity index score in the study: More than 19% of STEM workers are Hispanic or Latino, almost 20% are Asian and more than 8% are Black.
8. Los Angeles, CA
There are almost 98,600 STEM workers in Los Angeles, California. More than 68,750 of them (about 70%) are men and about 29,800 (just 30%) are women.
Los Angeles has the fourth-best race/ethnicity index in the study. Almost 26% of all STEM workers are Asian, almost 19% are Hispanic or Latino and more than 4% are Black. About 48% are white (which is the lowest percentage for this demographic in the top 10).
9. Dallas, TX
Though almost 72% of STEM workers in Dallas, Texas are men, the city ranks best overall in terms of its race/ethnicity diversity score. Black workers comprise almost 18% of the STEM workforce, Asian workers comprise more than 16%, Hispanic or Latino workers almost 14% and white workers just shy of 50%.
10. Fort Worth, TX
Of the total approximately 25,700 STEM workers in Fort Worth, Texas, about 17,600 are men (just over 68%) and about 8,100 are women (roughly 32%). In terms of race, less than 5% of workers are Asian, about 12% are Black and about 22% are Hispanic or Latino. Almost 53% are white.
Data and Methodology
To find the best cities for diversity in STEM, SmartAsset analyzed data for the 35 cities in the county with the largest STEM workforces. Specifically, we measured across the following metrics:
- Racial diversity index. We calculated this based on the racial diversity of a city among the main Census Bureau groups using the Shannon index. Cities with a more equally distributed workforce across the racial groups received a better score.
- Gender diversity index. This measures the number of women in the workforce compared to men. The city with the highest percentage of women in STEM jobs received a score of 100, and the city with the lowest percentage received a 0.
We averaged these two indexes to create our final score, which we used to rank the cities.
Data for both metrics comes from the Census Bureau’s 2019 1-year American Community Survey.
Tips for STEM Workers to Manage Their Money
- Ask for a raise. There has been a rising trend of employers giving promotions without a pay raise, according to a recent survey of 300 employers by the staffing firm OfficeTeam. If you are accepting a promotion and taking on more responsibility, be sure you are asking to be compensated fairly. One of the best ways to do this is to see what other people in your occupation are making. The BLS publishes annual employment statistics that show the average hourly and annual wage by occupation.
- Understand your paycheck. Seeking out cities that best accommodate a diverse workforce can be beneficial as you explore employment opportunities. But no matter where you live, you’ll have to pay taxes on each paycheck. See what your actual take-home pay will look like with SmartAsset’s free paycheck calculator.
- Seek expert financial advice. As your company diversifies its workforce, make sure you diversify your portfolio. If you need some extra guidance with mapping out larger financial goals like retirement, estate planning and portfolio management, it might be worth consulting a professional financial advisor. Finding the right financial advisor doesn’t have to be hard. SmartAsset’s free tool matches you with financial advisors in your area in five minutes. If you’re ready to be matched with local advisors that will help you achieve your financial goals, get started now.
Questions about our study? Contact press@smartasset.com.
Photo credit: ©iStock.com/poba