 Written by
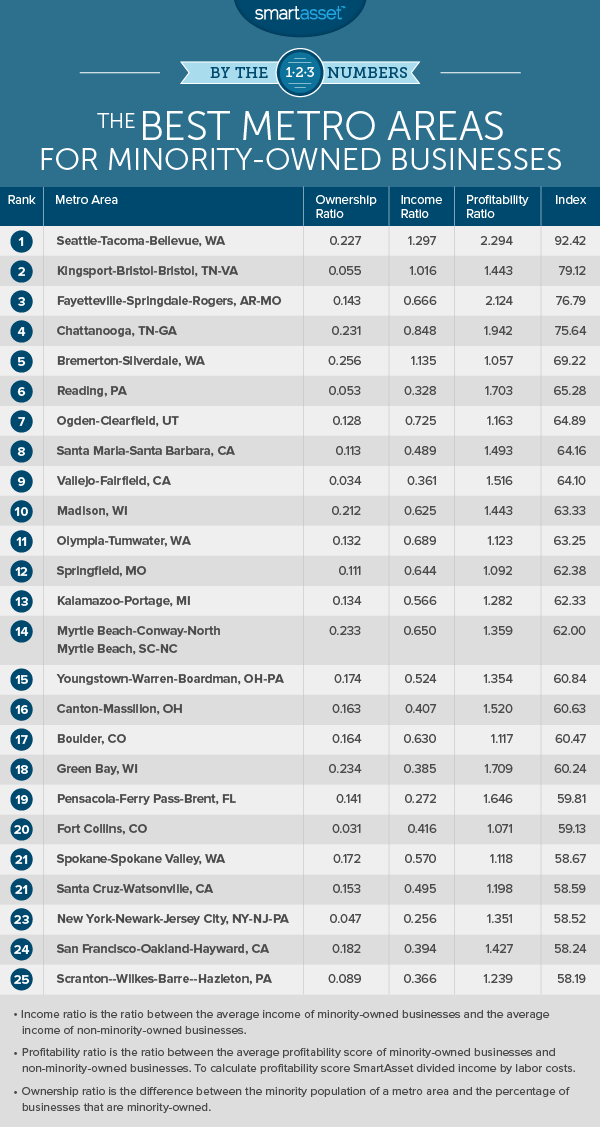
Owning your own business is a lot of work. While it can be rewarding, including financially, we were interested to see how opportunities compared for minority and non-minority business owners. SmartAsset decided to dig into the data to find out which metro areas in America are the best specifically for minority business owners. To do so, we looked at three variables – income ratio, profitability ratio and ownership ratio. See our full methodology at the end of the study.
Try SmartAsset’s investment calculator here.
Key Findings
- Wonderful Washington. Home to some of the most famous international brands, like Boeing and Starbucks, Washington takes three of the top ten spots on our list. This is due in large part to the strength in the income and profitability index. Firms in Washington can even be certified as minority-owned and/or woman-owned.
- Smaller cities do better. The average population of the top 10 metro areas was around 760,000, while the average population for all of the metro areas included in our study was around 1.3 million.
- Profitable minority businesses. While minority-owned businesses on average are smaller than non-minority-owned businesses our analysis shows they tend to have a higher profitability ratio.
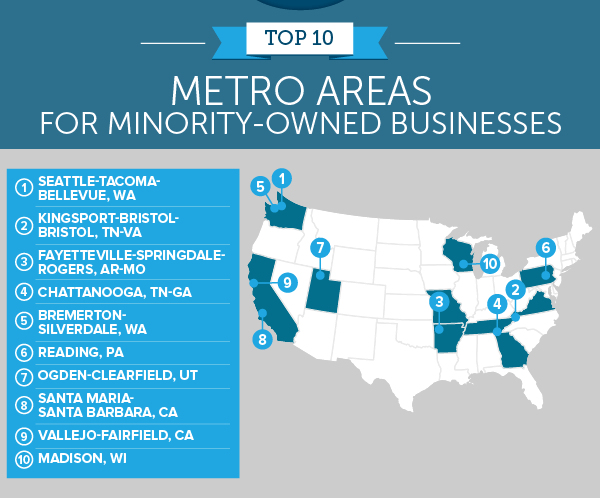
1. Seattle-Tacoma-Bellevue, WA
The Seattle metro area scores 1st in two out of the three criteria we looked at. It has a particularly high profitability ratio of 2.3. The area is also home to one of the largest minority-owned companies in the state, Town and Country Markets Inc., which had over $200 million in revenue in 2011.
Thinking about moving to Seattle? Check out the cost of living in Seattle.
2. Kingsport-Bristol-Bristol, TN-VA
This area is the birthplace of country music, according to a Congressional resolution passed in 1998. It’s also one of the smallest metro areas to make the cut for our study, with a population of only 300,000 in total. The Kingsport-Bristol-Bristol metro area did well in our rankings mainly because of its ownership ratio (the difference between the minority population percentage and the minority business owner percentage). According to Census data, the minority population is around 4% and the minority business ownership rate is around 4%.
3. Fayetteville-Springdale-Rogers, AR-MO
Home of three Fortune 500 companies (Walmart, Tyson Foods and JB Hunt Transport), the Fayetteville-Springdale-Rogers metro area scored high partially because it had the second highest profitability ratio of 2.124. The metro area also has a low unemployment rate of around 4%.
4. Chattanooga, TN-GA
Chattanooga is similar to the other metro areas so far listed in that is has a very high profitability ratio for minority-owned businesses. In this case it is 1.942. Chattanooga’s ownership ratio of .231 is also slightly better than the national average of .236.
Chattanooga has a specialized Diversity and Inclusion development program as part of its Chamber of Commerce to support minority-owned businesses.
5. Bremerton-Silverdale, WA
The second metro area in Washington in our top five is even smaller than the first. With a population of 253,000, the Bremerton-Silverdale metro area barely passes the 250,000 filter. Still the metro area had the second highest income ratio on our list at 1.135. The only area with a higher score in income ratio is the Seattle metro area.
6. Reading, PA
Monopoly fans will recognize this city! Even though Reading has diminished from its heyday as a railroad hub in the early 1900s, it still does well in our ranking. This is largely because of its great ownership ratio of .053.
7. Ogden-Clearfield, UT
Ogden has been a bit of a boom town since the 90s. It has seen an almost 40% increase in population since that time. Some of that growth has been with minority populations. According to the Census, people identifying as Latinos now make up around 25% of the population. Ogden does above average in all the metrics in our study. The metro area’s ownership ratio and income ratio scores stand out at .128 and .725, respectively.
8. Santa Maria-Santa Barbara, CA
The highest-scoring metro area from California, Santa Maria-Santa Barbara is known for its wine and BBQ. Our analysis shows the city is also a great place for minority-owned businesses. According to the Census data, minorities make up 26% up the population but 27% of the business owners. That gives the area one of the highest ownership ratios on our list.
Try SmartAsset’s mortgage calculator here.
9. Vallejo-Fairfield, CA
Barely edged out by the Santa Maria-Santa Barbara metro area for the crown of best metro area for minority-owned businesses in California, Vallejo has a better ownership ratio than Santa Maria (.034 to .113) but falls behind because of its income ratio (.361 to .481).
10. Madison, WI
The only capital city to break into the top ten, Madison does well because of consistently strong if unspectacular scores across the board. With its young population and low unemployment rate, this is not only a great place for minority-owned businesses. Madison also cracked the top ten list for our best cities for new college grads.
Methodology
In order to conduct our study we used the Census’ 2012 Survey of Business Owners. We compared minority-owned businesses to non-minority-owned businesses in all metro areas included in the survey. In order to stay consistent, the study only looked at businesses which were classified as minority-owning and non-minority-owning rather than compare all the statistics by each race. We then applied a population filter of 250,000 ending up with a sample of 181 metro areas.
The three variables we looked at were income ratio, profitability ratio and ownership ratio. In order to create the ownership ratio we compared the percentage of the metro area’s population characterized as minority to the percentage of the businesses owned by minorities. So, for example, a metro area did well if it had a 5% minority population and a 5% minority business ownership rate.
The other two scores look at how successful minority-owned businesses are in a metro area compared to non-minority-owned businesses. The income ratio shows how much the average minority-owned business makes compared to the average non-minority-owned business.
The profitability ratio is similar to the income ratio except that it also includes labor costs. To create the profitability ratio we took average income of minority and non-minority firms, then divided them by their respective labor costs. We then divided minority profitability by non-minority profitability. So if a metro area has a profitability score greater than 1, it means in that metro area minority-owned businesses bring in more income per labor than non-minority-owned businesses.
Questions about our study? Contact us at blog@smartasset.com.
Photo credit: ©iStock.com/Yuri_Acurs