 Written by
By almost any measure, income inequality in the United States has grown steadily over the past few decades. According to a recent study by the Economic Policy Institute, between 1979 and 2012 the top 1% saw incomes rise over 200%, while everyone else saw income growth of just 18.7%. Those are certainly dramatic figures, but what do they mean for the lives—and paychecks—of actual income earners? To answer that question, SmartAsset developed an alternate measure of income inequality, based on the money earned by workers at the top and the bottom of the income ladder.
Try our free rent vs. buy calculator.
Using Bureau of Labor Statistics data, we compared annual earnings for the nearly 12 million workers in foodservice jobs (who often do not receive retirement benefits or health insurance) with the 6.5 million workers employed in management occupations.
We found the ratio of pay between these two classifications of workers over a period of 15 years, from 1999 to 2013, in all 50 states and Washington, D.C. The results demonstrate that while top earners have indeed been taking home larger salaries, many of the lowest-paid workers have seen their real take-home pay shrink over the past 15 years.
Mapping Income Inequality in America
To see what this inequality growth looks like visually, SmartAsset has created the below map. (Note: This map is no longer supported or maintained.) Adjust the slider at the top of the map to see how inequality has changed since the start of the millennium. The first tab, labeled “Inequality Growth,” reflects the percentage growth since 1999 in the ratio of management pay to foodservice pay—darker colors indicate higher growth rates.
The other two tabs, “Highest Inequality” and “Lowest Inequality,” reflect the level of the ratio itself. Darker colors here indicate higher overall inequality. Hover over individual states to see the growth rate and inequality ratio for that state in the selected year. Check out the table below the map to see data on the top ten states for the selected year and category.
Ups and Downs
Over the 15-year period we examined, the U.S. economy went through two recessions (one minor and one major), a period of robust economic growth between those two recessions, and a period of more moderate growth in the four years since.
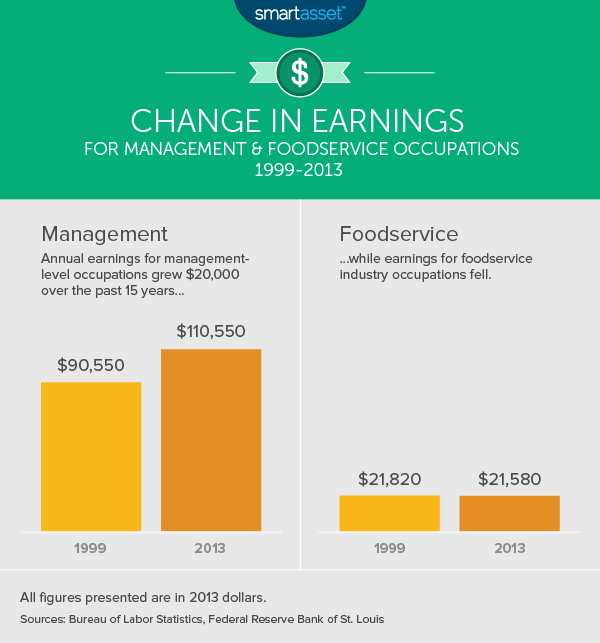
Throughout that time, average earnings for management-level occupations grew steadily, increasing by $20,000 over the whole period. Meanwhile, earnings for foodservice industry occupations have remained completely flat. In 1999, these workers earned an average of $21,820 a year (in 2013 dollars). By 2013, they were earning $21,580.
Unsurprisingly, that places foodservice workers at the very bottom of the U.S. income scale. According to the BLS, six of the seven jobs with the lowest average wages are foodservice jobs. Those six occupations (which employ a combined 5.2 million Americans) all pay less than ten dollars an hour on average, a wage at which such financial goals as homeownership and retirement typically remain well out of reach.
Who is Affected
As of 2013, there were nearly 12 million workers nationwide employed in the occupational class the Bureau of Labor Statistics (BLS) defines as “Food Preparation and Serving Related Occupations,” which includes jobs like chef, dishwasher, waitress and bartender. That makes it the third largest occupational class behind “Office and Administrative Support Occupations” and “Sales and Related Occupations” (which includes all retail workers).
Meanwhile, some 6.5 million Americans are employed in what the BLS defines as “Management Occupations.” Those positions pay an average of $110,550 a year, or $53.15 an hour. That is more than five times the average earnings of foodservice occupations. If that ratio seems high, it is, from a historical perspective. Since 1999, the national ratio between average earnings for management occupations and foodservice occupations has risen 23%.
Impact of the Minimum Wage
While the federal minimum wage has been raised twice in the past 18 years, many states have enacted and raised their own minimum wages to keep pace with inflation and the rising cost of living. The impact of those state laws is evident in the state measurements of the income inequality ratio.
Of the 21 states with a minimum wage either at or below the federal limit (as of 2013), including the five states with no minimum wage law, six rank among the top ten states with the largest disparity between management and foodservice earnings in 2013.1 On the other hand, none of the seven states that had a minimum wage at least one dollar higher than the federal minimum in 2013 were among the top ten for highest inequality between management and foodservice workers.
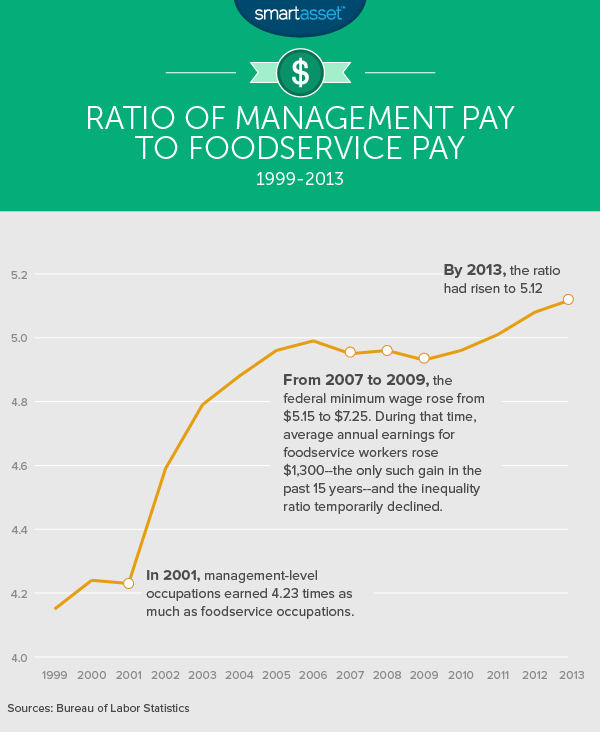
The trend of inequality growth likewise demonstrates the impact of minimum wage laws. As the chart above reflects, the only period of sustained growth in foodservice incomes over the past fifteen years came between 2007 and 2009, three years during which the federal minimum wage increased by over 40%. During that time, average earnings for food-service occupations grew by $1,300, and the pay ratio fell from 4.99 to 4.93—but then continued growing, reaching the historic high of 5.12 in 2013.
Data & Methodology
All of the income data used in our study comes from the Bureau of Labor Statistics Occupational Employment Survey. The inequality ratio is calculated by dividing average earnings for management occupations (occupation code 11-0000) by food preparation and serving occupations (occupation code 35-0000).
In order to control for inflation, we used price level data from the Saint Louis Federal Reserve Board. All of the incomes in our study are presented in 2013 dollars.
Questions about our study? Contact us at blog@smartasset.com.
Photo credit: flickr
1. In states with a state-mandated minimum wage lower than the federal minimum (including states with no minimum wage law), workers are paid the federal level. That means the federal minimum acts as the state minimum in 21 states.