 Written by
Airbnb has not only changed the way a lot of people travel, but also the way that many investors take advantage of their real estate properties. Rather than picking from hotel chains and relatively pricey boutique inns, travelers might instead rent out someone’s home or a room in that home. Investors are noticing this and adjusting accordingly, finding ways to make a stay in their home or property more appealing than traditional lodging. Some are even seeking out specialized guidance from financial advisors in order to take advantage of their location and charge competitive rental rates. SmartAsset has analyzed these and other metrics to put together this list of the cities where investors are most taking advantage of Airbnb.
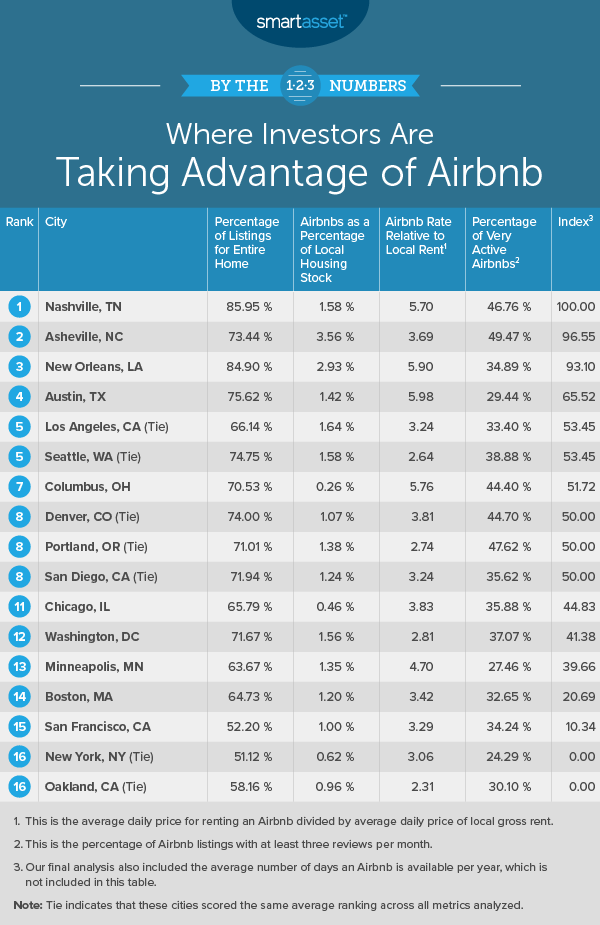
To create this list, we compared 17 cities across five metrics: the percentage of listings for which the entire home/apartment is available, Airbnbs as a percentage of local housing stock, Airbnb rates compared to local rents, the percentage of very active Airbnb listings and the average days available per Airbnb. For details on our data sources and how we put it all together to create our final rankings, see the Data and Methodology section below.
This is SmartAsset’s second annual look at where investors are taking advantage of Airbnb. Read the 2018 version of the study here.
Key Findings
- Southern comfort. Four of our top-7 cities are in states located in Southern states. The Northeast is absent from the top of our list.
- Fab five. Though there’s a bit of shuffling, the top 5 cities on our 2018 list are the same this year. New Orleans, Louisiana holds third place for the second year in a row.
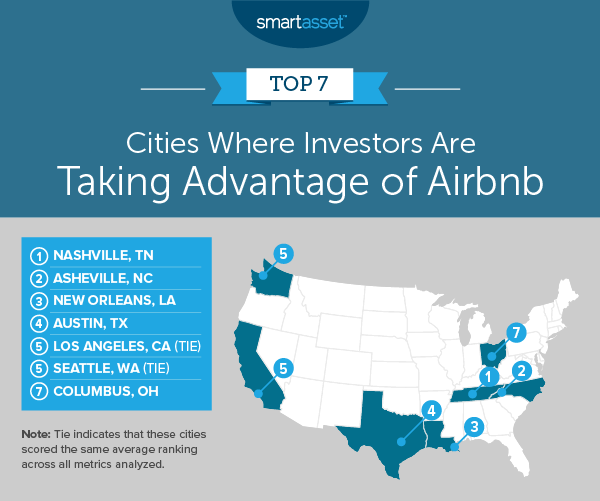
1. Nashville, TN
Nashville tops this list. In Music City, 85.95% of all listings are for the entire home, the highest percentage in this study. The average daily Airbnb rate is 5.70 times the average daily rent rate, the fourth-best rate in this study. Each Airbnb property is available for an average of 184 days, the second-best rate among all 17 cities in this study. Nashville ranks in the top five for all of the metrics we analyzed. Overall, investing in an Airbnb property in Nashville might be a smart decision to make with your financial advisor.
2. Asheville, NC
Another Southern city is next – Asheville, North Carolina. Asheville tops this study in three separate metrics: percentage of local housing stock, percentage of very active listings and average available days. Airbnb listings make up 3.56% of local housing stock, 49.47% of the listings are very active (meaning that they’re rented out at least three times per month) and the average Airbnb is available to rent for 187 days. Asheville doesn’t fare quite as well in the other two metrics. Less than three quarters of all listings – 73.44% to be precise – are for the entire house. Asheville ranks sixth for this metric in the study overall. The average Airbnb rate here is 3.69 times the average daily rent and the city ranks eighth for this metric in the study as a whole.
3. New Orleans, LA
New Orleans comes in third on our list of top 7 places where investors are taking advantage of Airbnb. The Big Easy holds the second-highest rate in the study for percentage of listings for the entire home, at 84.90%. It also ranks second-highest out all 17 cities in our study for percentage of local housing stock – at 2.93% – and rate relative to local rent – at 5.90. New Orleans is also one of the top cities for new college grads.
4. Austin, TX
Austin, Texas rounds out the quartet of Southern cities leading this study as great places to have an investment property for Airbnb. It boasts an Airbnb community where 75.62% of the listings are for the entire home, the third-highest rate overall. The Airbnb rate is 5.98 times the average local rent. That’s the highest rate in the study, so this is the city where renters stand to earn the biggest potential profit from using Airbnb. Austin doesn’t fare as well in the very active Airbnb metric, since only 29.44% of listings are categorized as very active, the third-lowest rate in the study.
5. Los Angeles, CA (tie)
Los Angeles, California is the first of two cities in our top 7 to tie for fifth place. In Los Angeles, 1.64% of all homes are listed as Airbnbs. That’s the third-highest percentage in this study. Los Angeles also ranks well for number of days available: the average Airbnb here is available to be rented for 167 days, which is the fourth-highest amount for this metric in the study overall. That could lead to an attractive revenue stream you should discuss with your financial advisor or financial planner.
5. Seattle, WA (tie)
Seattle, Washington ties with Los Angeles for fifth place. It comes in fourth for two different metrics: percentage of listings that are for the entire home (at 74.75%) and Airbnbs as a percentage of local housing stock (at 1.58%). The Emerald City also ranks sixth overall for percentage of very active Airbnb rentals. More than one-third of Airbnb listings – 38.88% to be exact – are rented out at least three times per month.
7. Columbus, OH
Columbus, Ohio rounds out the list and is the only Midwestern city in our study to rank in the top 7. Columbus ranks third-highest in the study overall for the metric of Airbnb rate relative to the local rent: the Airbnb rental rate is 5.76 times the average local rent. Columbus also comes in fifth in terms of the percentage of listings considered very active, at 44.40%. The city doesn’t do as well when it comes to the percentage of the local housing stock listed on Airbnb. At just 0.26%, it ranks last for this metric overall. If you’re thinking of getting a mortgage here for an Airbnb property, consider finding a financial advisor.
Data and Methodology
To assemble our list of the cities where investors are most taking advantage of Airbnb, we analyzed data for 17 cities. Specifically, we considered five metrics:
- Percentage of listings for entire home. This shows the percentage of listings for which the entire home/apartment is available. Data comes from InsideAirbnb.com and is the most up-to-date listing for each city.
- Airbnbs as a percentage of local housing stock. This is the total number of Airbnb listings divided by the total number of housing units. Data on Airbnb listings comes from InsideAirbnb.com and is the most up-to-date listing for each city. Data on housing units comes from the Census Bureau’s 2017 1-year American Community Survey.
- Airbnb rate relative to local rent. This is the average daily price for renting an Airbnb divided by average daily price of local gross rent. Data comes from InsideAirbnb.com and is the most up-to-date listing for each city. Data on local rents comes from the Census Bureau’s 2017 1-year American Community Survey.
- Percentage of very active Airbnb rentals. This is the percentage of Airbnb listings rented out at least three times per month. Data comes from InsideAirbnb.com and is the most up-to-date listing for each city.
- Average available days per Airbnb. This is the number of days per year the average Airbnb is available to be rented. Data comes from InsideAirbnb.com and is the most up-to-date listing for each city.
To create our final score, we ranked each city in each metric. Then we found each city’s average ranking, giving equal weight to each metric. Using this average ranking, we assigned a score to each city. The city with the best average ranking received a score of 100, while the city with the worst average ranking received a 0.
Note: In order to retrieve the most accurate data, we only included Airbnb listings with at least 0.5 guests per month for every metric analyzed.
Tips for Managing Your Money
- Considering finding new income streams? Talk to a financial advisor. Finding the right financial advisor that fits your needs doesn’t have to be hard. SmartAsset’s free tool matches you with financial advisors in your area in 5 minutes. If you’re ready to be matched with local advisors that will help you achieve your financial goals, get started now.
- Manage your mortgage early. If you’re thinking of buying a home, you’ll need to know what your monthly mortgage payment will be. Get a sense of what it might look like with SmartAsset’s free mortgage calculator.
Questions about our study? Contact us at press@smartasset.com
Photo credit: ©iStock.com/FG Trade