 Written by
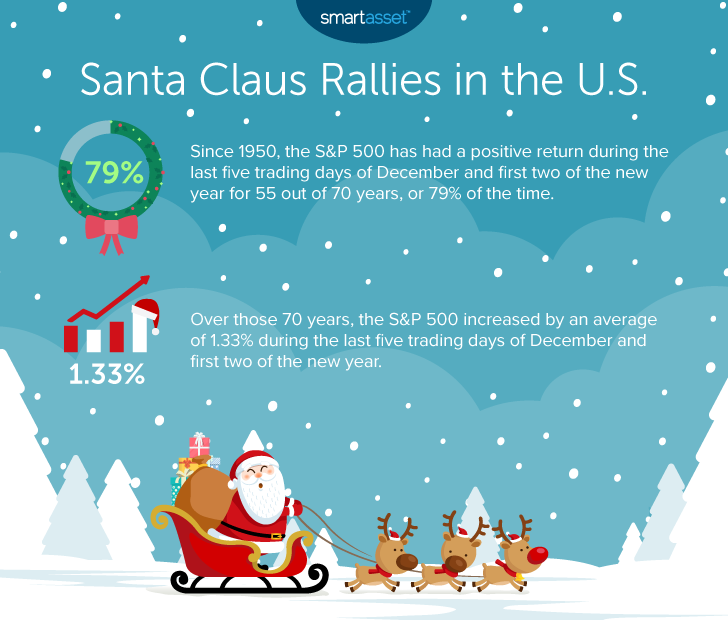
The U.S. stock market hit record highs leading up to Thanksgiving in 2020. Two days before the holiday this year, the Dow Jones and S&P 500 indexes broke 30,000 and 3,600 points, respectively. While some stock analysts and investors are concerned that these prices belie a frothy market soon set to pop, others speculate that highs will continue over the next month. In the investing world, the uptick in stock market performance at the end of the year is commonly referred to as the Santa Claus rally, gifting investors jolly gains in their portfolios.
Researchers have suggested a variety of theories as to why the Santa Claus rally happens. Some cite a general feeling of optimism and the investment of holiday bonuses. Others offer more concrete reasons, including tax considerations or the idea that more bullish retail investors tend to take control of the market when institutional investors go on vacation over the holidays. While the exact reasons a Santa Claus rally does or does not occur are difficult to determine, SmartAsset decided to examine how often these rallies happen and their typical magnitude.
In this study, we considered the performance of the S&P 500 during the last five trading days of December and first two trading days of January. Though time frames and market indexes vary when studying the Santa Claus rally, we used these frames of reference for two reasons. First, this time period follows the Stock Trader’s Almanac’s definition of Santa Claus rallies. And second, the S&P 500 is considered by many investors to be the most accurate representation of the general performance of the stock market. Beyond looking at general effects the Santa Claus rally has on the market, we studied how recessions have historically affected both the odds of Santa Claus rallies as well as their scale. For details on our data sources and how we put the information together to create our findings, check out the Data and Methodology section below.
Key Findings
- Santa Claus visits the stock market about four out of every five years, suggesting the rally is real. A Santa Claus rally has materialized about 79% of the time since 1950. S&P 500 returns during the last five trading days of December and first two of the subsequent new year were positive for 55 of the 70 years between 1950 and 2020 – and negative for only 15.
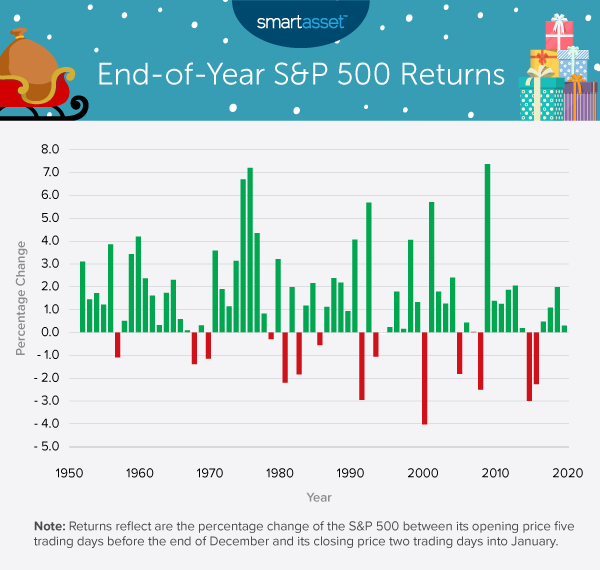
- Over the past 10 years, Santa Claus rally effects have been relatively muted. Between 2010 and 2020, the stock market saw an average Santa Claus rally of only 0.38%, compared to 1.33% from 1950 to 2020. From 2014 to 2015 and 2015 to 2016, the S&P 500 declined by 3.01% and 2.27%, respectively, during the last five trading days of December and first two of January. Most recently, the S&P 500 gained about nine points – or an increase of 0.29% – during the last five trading days of 2019 and first two of 2020.
- During recessions, end-of-year returns tend to be more volatile. Though Santa Claus rallies have a similar frequency during recessions, the gross returns have been both higher and lower than average. The average positive return during a Santa Claus rally in a recession is 4.44%, relative to the average positive return between 1950 and 2020 of 2.17%. Meanwhile, the average negative return during end-of-year trading in a recession is -2.44%, compared to only -1.76% across the total 15 negative return periods.
Santa Claus Rally Effects
On average between 1950 and 2020, the S&P 500 rose by 1.33% during the last five trading days of December and first two of the following new year. This is significantly higher than the expected probability that the S&P 500 would increase by that amount over a seven-day trading period. According to Trefis, a stock price and analysis company, there is about a 31% chance that the S&P 500 will increase by 1.33% over seven trading days. In other words, Santa Claus rallies happen more than twice as often as one would expect.
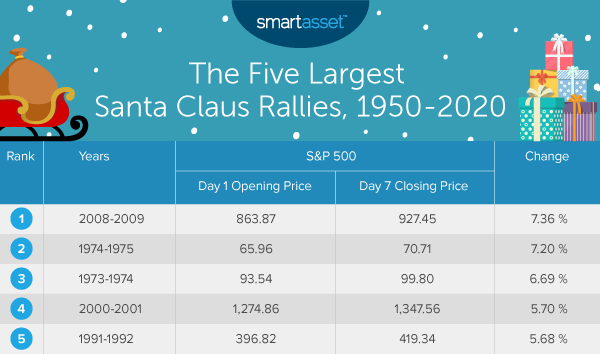
The largest rally occurred between 2008 and 2009, and the 1974-1975 rally is a close second. During the last five trading days of 2008 and first two trading days of 2009, the S&P 500 rose by about 63 points, or 7.36%. The table below shows the five largest Santa Claus rallies between 1950 and 2020.
How Do Recessions Affect the Santa Claus Rally?
Interestingly, the two largest Santa Claus rallies from 2008 to 2009 and 1974 to 1975 occurred toward the end of two significant U.S. recessions – the Great Recession, from December 2007 to June 2009, and the 1973-1975 recession, from November 1973 to March 1975. This correlation raises the question: Do Santa Claus rallies happen more often or less often during recessions?
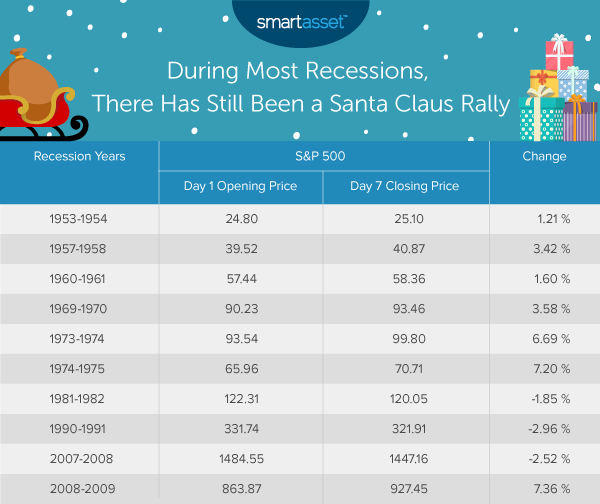
Between the beginning of 1950 and early 2020, there were 10 total periods a Santa Claus rally could have taken effect during a recession. Out of those periods, a rally occurred seven times. Given the small sample size, the rate of Santa Claus rallies during recessions is roughly comparable to the typical rate of 79%.
As noted previously, while Santa Claus rallies take place about as often during recessions as they do generally, they tend to have larger positive and negative returns. The three largest Santa Claus rallies (2008-2009, 1974-1975 and 1973-1974) occurred during recessions, as did the worst end-of-year periods (1990-1991 and 2007-2008). The table below shows recessions that overlapped with the end of the year as well as the S&P 500 returns during that time.
Data and Methodology
Data for this study comes from Yahoo Finance. We looked at the S&P 500 price index, considering the opening price five trading days before the end of December and the closing price two days into the following new year. For each year between 1950 and 2020, we calculated the percentage change between those two figures.
Tips for Maximizing Your Investments at the End of the Year
- Top off your retirement account contributions. Whether or not Santa is kind to you in the market this year, you can still seize the reins of your financial planning when it comes to your retirement accounts. In 2020, the IRA contribution limit is $6,000 for people under 50 and $7,000 for people 50 and older. The 401(k) contribution limit is $19,500 and $26,00 for people 50 and older. While you can continue to contribute to your IRA up until the tax filing deadline, deposits to your 401(k) plan are typically due by the end of the calendar year. If you have extra cash on hand and want to bolster your retirement savings, take a look at how much you have added throughout the year and how much room you have to add more.
- Consider a charitable donation. As you deck the halls and hope Kris Kringle brings some fa-la-la to your portfolio, you can also bring some joy to the world through strategic altruism. After all, making charitable donations at the end of the year is one way to reduce your overall tax burden. If you have a charity in mind and want to claim your donation as tax-deductible, you must make your donation before December 31. Check out our guide here on tips for making charitable donations.
- Seek out expert advice. Investing is complicated, as we see in the art of reading the tea leaves on year-end market performance. A financial advisor can help you make smarter financial decisions and be in better control of your money — whether or not Santa shows in a given year. Finding the right financial advisor doesn’t have to be hard. SmartAsset’s free tool matches you with financial advisors in your area in five minutes. If you’re ready to be matched with local advisors that will help you achieve your financial goals, get started now.
Questions about our study? Contact us at press@smartasset.com.
Image credit: ©SmartAsset