 Written by
The past year has been a difficult time for many working parents who have had to balance remote work, potential job losses, school closings and limited access to childcare. A February 2021 survey by Joblist says that 47% of parents are working more hours per week on average than they were before the COVID-19 pandemic, making their work-life balance even more challenging. Additionally, many working parents report financial stress. Since the onset of COVID-19, the percentage of parents who are moderately or extremely concerned about their family’s financial outlook jumped by about 12 percentage points, from 27.3% to 39%.
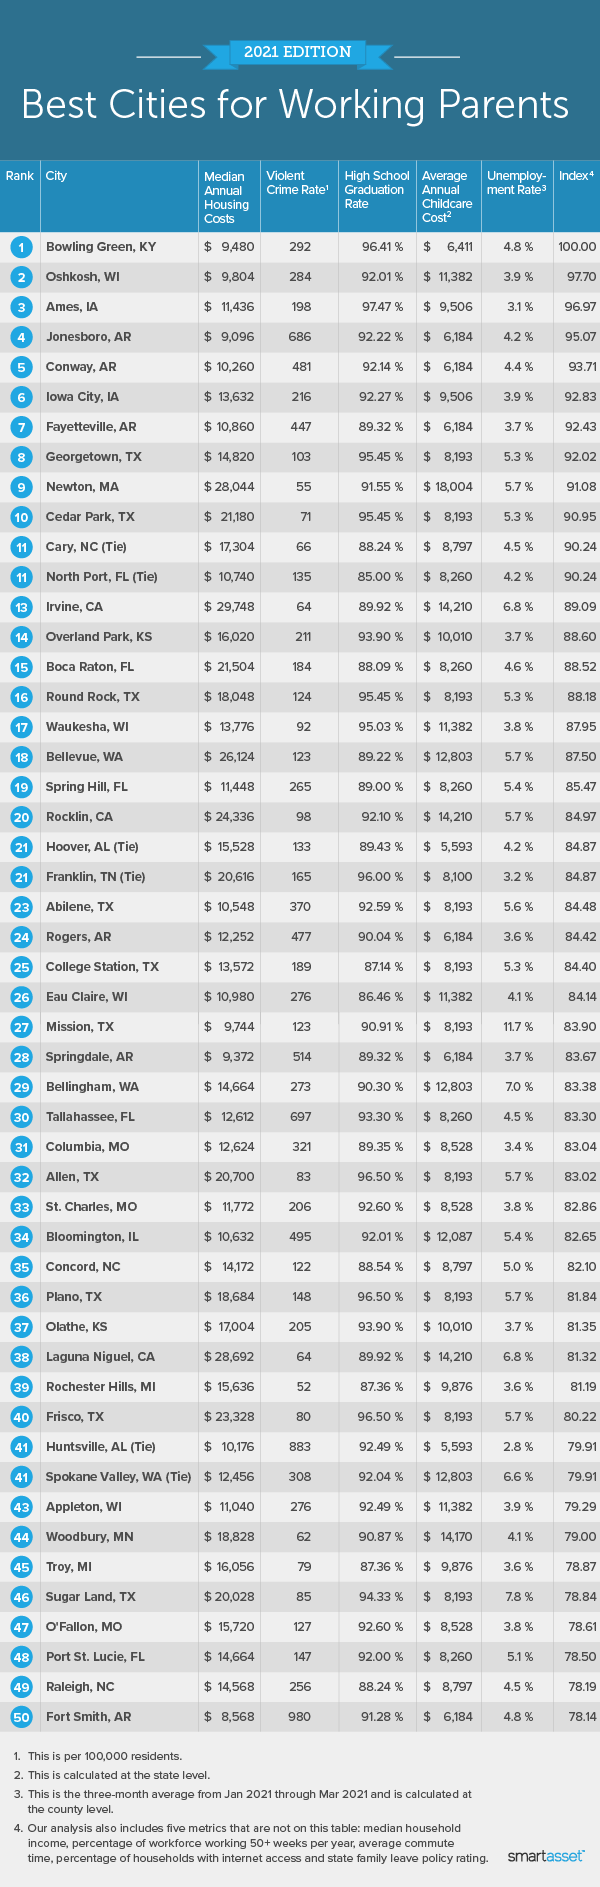
While the burdens of the pandemic are widespread, being a working parent may be easier in some places than others. In this study, SmartAsset looked at topics including employment, housing, safety and education to determine the best cities for working parents in 2021. Specifically, we compared 575 cities across 10 metrics: unemployment rate, median household income, median annual housing costs, percentage of the workforce working 50 or more weeks per year, percentage of households with internet access, average commute time, violent crime rate, high school graduation rate, state family leave policy rating and average annual childcare costs. For details on our data sources and how we put all the information together to create our final rankings, check out the Data and Methodology section below.
This is SmartAsset’s 2021 edition of our study on the best cities for working parents. Take a look at the 2020 edition here.
Key Findings
- Three Arkansas cities rank in our top 10. The Arkansas cities of Jonesboro, Conway and Fayetteville rank fourth, fifth and seventh in our study, respectively. All three cities rank in approximately the top quarter of our study for the following metrics: average commute time, unemployment rate and high school graduation rate. Additionally, the state of Arkansas has the third-lowest average annual childcare costs – less than $6,200, according to data from the Economic Policy Institute.
- Average annual childcare costs range from roughly $5,100 to more than $21,600. Using data from the Economic Policy Institute, we calculated average annual childcare costs, averaging the expected annual cost of infant care and the cost for care for a four-year old in each state. The difference between average costs in Mississippi and the District of Columbia is about $16,500. Behind the District of Columbia, Massachusetts has the second-highest average annual childcare costs, at roughly $18,000.
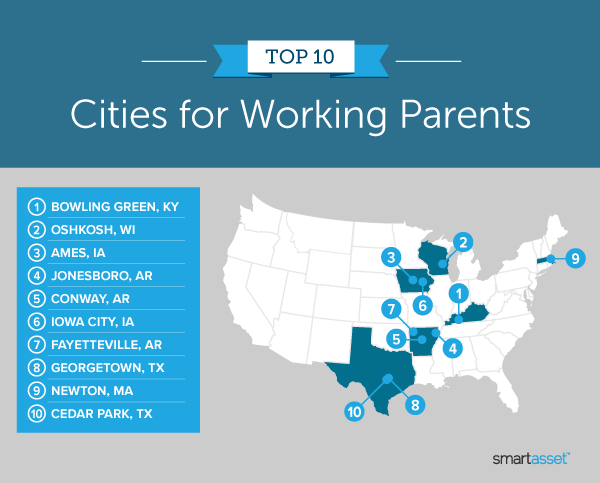
1. Bowling Green, KY
Bowling Green, Kentucky ranks in the top third of cities for six of the 10 metrics in our study. It has the 29th-lowest median annual housing costs ($9,480), the 29th-lowest percentage of the workforce working 50 or more weeks per year (51.3%) and the 102nd-lowest average commute time (about 20 minutes). The unemployment rate is 115th-lowest (4.8%), and the high school graduation rate is seventh-highest (over 96%). Average annual childcare costs in Kentucky are about $6,400, the fourth-lowest across all 50 states and the District of Columbia.
2. Oshkosh, WI
With relatively affordable housing and low unemployment, Oshkosh, Wisconsin ranks as a top city for working parents. Census Bureau data shows that median annual housing costs in the city are about $9,800, the 41st-lowest out of all 575 cities in our study. Oshkosh also has the 41st-lowest average unemployment rate from January 2021 through March 2021 (3.9%). Beyond those two metrics, Oshkosh ranks in the top 50 cities for its low average commute time (about 17 minutes) and high graduation rate among high schoolers (more than 92%).
3. Ames, IA
Falling one spot from its No. 2 ranking last year, Ames, Iowa still performs well on many of the metrics in our study. While the median household income is only about $50,500 (placing the city in the bottom 50 for this metric), the city ranks in the top 20 of the study for four metrics: high school graduation rate (more than 97%), percentage of the workforce working 50 or more weeks per year (only about 42%), unemployment rate (3.1%) and average commute time (roughly 16 minutes).
4. Jonesboro, AR
Median annual housing costs in Jonesboro, Arkansas are 17th-lowest (and the lowest in our top 10 cities), at roughly $9,100. Jonesboro ranks in the top 100 cities for five additional metrics. It has the 77th-lowest percentage of its workforce working 50 or more weeks per year (55.2%) and 82nd-lowest average commute time (about 19 minutes). The average unemployment rate from January 2021 through March 2021 was 4.2%, the 59th-lowest in our study. Finally, the high school graduation rate is 92.22% and average annual childcare costs are about $6,200.
5. Conway, AR
During COVID-19, many working parents have had to rely on reliable and strong internet connections for both remote work and potentially children’s remote school. Almost 95% of households in Conway, Arkansas have internet access, the 70th-highest rate in our study. Additionally, housing costs are low while most high schoolers graduate. According to data from the Census Bureau and County Health Rankings, median annual housing costs in Conway are the 58th-lowest overall ($10,260) and the high school graduation rate is the 43rd-highest (exceeding 92%).
6. Iowa City, IA
Only about 51% of the workforce in Iowa City, Iowa works between 50 and 52 weeks per year, a benefit for working parents who may need to prioritize commitments outside of their jobs. Iowa City also has a low unemployment rate (3.9%) and strong high school graduation rate (92.27%). Average annual childcare costs in Iowa (roughly $9,500) are the 23rd-lowest across all 50 states and the District of Columbia.
7. Fayetteville, AR
Home to the University of Arkansas campus, Fayetteville, Arkansas comes in at No. 7 in our top 10. Even though it ranks within the bottom 100 cities for its relatively high median household income, it ranks in the top fourth of the study for its relatively low figures for five metrics: median annual housing costs ($10,860), percentage of the workforce working 50 or more weeks per year (54.4%), average commute time (about 18 minutes), unemployment rate (3.7%) and average annual childcare costs (roughly $6,200).
8. Georgetown, TX
Located in central Texas, Georgetown ranks as the No. 8 city for working parents in our study. The city ranks in the top 50 for two metrics: a relatively low violent crime rate (about 100 violent crimes for every 100,000 residents) and high school graduation rate (95.45%). Georgetown ranks in the top third of cities for three additional metrics. It has the 139th-highest percentage of households with internet access (92.77%) and the 155th-lowest unemployment rate (5.3%). Additionally, the Lone Star state has the 14th-lowest average annual childcare costs, at roughly $8,200, of all 50 states and the District of Columbia.
9. Newton, MA
The median household income in Newtown, Massachusetts is more than $150,100, the fifth-highest across the 575 cities in our study. The Boston suburb also ranks well for its low violent crime rate (less than 55 violent crimes per 100,000 residents) and high percentage of households with internet access (95.80%). Finally, according to data from the National Partnership for Women and Families, Massachusetts has the best state family leave policy rating of all 50 states and the District of Columbia.
10. Cedar Park, TX
Cedar Park, Texas ranks in the top fifth of the study for five metrics. It has the 71st-highest median household income (about $101,500), the 68th-highest percentage of households with internet access (almost 95%) and the 11th-highest high school graduation rate (more than 95%). FBI crime data from 2019 shows that there were about 70 violent crimes for every 100,000 residents in the city. Finally, as previously noted, Texas has the 14th-lowest average annual childcare costs.
Data and Methodology
To rank the best cities for working parents, SmartAsset looked at the 600 largest cities in the U.S. Of those, 575 had complete data across the following 10 metrics:
- Unemployment rate. This is the average unemployment rate for the three months of January, February and March of 2021. Data comes from the Bureau of Labor Statistics and is measured at the county level.
- Median household income. Data comes from the Census Bureau’s 2019 1-year American Community Survey.
- Median annual housing costs. This includes owner- and renter-occupied housing units. Data comes from the Census Bureau’s 2019 1-year American Community Survey.
- Percentage of the workforce working 50 or more weeks per year. This is the percentage of the population between the ages of 16 and 64 who work between 50 and 52 weeks per year. Data comes from the Census Bureau’s 2019 1-year American Community Survey.
- Percentage of households with internet access. Data comes from the Census Bureau’s 2019 1-year American Community Survey.
- Average commute time. This is the average number of minutes it takes to get to work. Data comes from the Census Bureau’s 2019 1-year American Community Survey.
- Violent crime rate. This is the number of violent crimes per 100,000 residents. Data comes from the FBI Uniform Crime Reporting Program and is for 2019. For cities where FBI data was unavailable, we used Neighborhood Scout data.
- High school graduation rate. Data comes from the 2021 County Health Rankings.
- State family leave policy rating. This is a state-by-state ranking that reflects the degree to which each state improves upon federal law concerning paid or unpaid workplace leave. Data comes from the National Partnership for Women and Families’ report on working family caregivers and was released in 2018.
- Average annual childcare costs. This is the average of the average annual cost of infant care and average cost for care for a four-year-old in each state. Data comes from the Economic Policy Institute.
To create our final ranking, we ranked each of the 575 cities in every metric. We then found each city’s average ranking, fully weighting all metrics except percentage of households with internet access and average commute time, each of which were half-weighted. We used the average ranking to determine a final score. The city with the highest average ranking received a score of 100 and the city with the lowest received a score of 0.
Savings Tips for Working Parents
- Make a plan and review it regularly. One of the best ways to save more is through budgeting. Our budget calculator can help you keep track of this. Beyond letting you see how much of your monthly and annual income goes towards the various costs of raising a child, you can see how cutting back on discretionary expenses can increase your savings rate.
- Make your money work for you. By planning and saving early you can take advantage of compound interest. Take a look at our investment calculator to see how your investment can grow over time.
- Consider professional financial help. A financial advisor can help you make smarter financial decisions to be in better control of your money. SmartAsset’s free tool matches you with financial advisors in your area in 5 minutes. If you’re ready to be matched with local advisors that will help you achieve your financial goals, get started now.
Questions about our study? Contact us at press@smartasset.com.
Photo credit: ©iStock.com/Morsa Images