 Written by
  Finding an affordable home has become an increasingly daunting endeavor. As the COVID-19 pandemic took hold in the U.S., home prices soared while incomes remained stagnant. In fact, Zillow and Census Bureau data shows that between 2019 and 2020, the average home value rose at a rate more than double the median household income (5.09% vs. 2.48%). And while most experts recommend that a home’s sale price not exceed 2.5 times your household income, that rule of thumb is growing difficult to follow as homes grow less affordable.
Using newly-released 2020 income data from the Census Bureau and home value data from Zillow, SmartAsset took a closer look at home affordability across the U.S. We began by examining home value-to-income ratios in each state. Then, we determined where homes prices are rising faster than incomes. To do so, we considered the difference between the one-year change in average home value and one-year change in median household income for all 50 states and the District of Columbia. Read our Data and Methodology section below to see where our data comes from and how we ranked states.
Key Findings
- The home value-to-income ratio exceeds 2.5 in all but one state, West Virginia. Average home values and median household incomes show that in general, homes are not affordable for the average American household. Across all 50 states and the District of Columbia, the average home value-to-income ratio falls under 2.5 only in West Virginia. Whether or not the Mountain State’s country roads take you home, it’s a particularly affordable alternative to the eight states where the home value-to-income ratio exceeds five, more than double what is recommended.
- Homes are becoming more affordable for residents in six states and the District of Columbia. From 2019 to 2020, the median household income increased more than the average home value in the following places: Alaska, Vermont, Hawaii, District of Columbia, Illinois, Rhode Island and Arkansas. The difference was most pronounced in Alaska where the median household income rose by 6.27% while the average home value increased only 1.76%. As a result, the home value-to-income ratio in the Last Frontier decreased from 3.85 to 3.68 from 2019 to 2020.
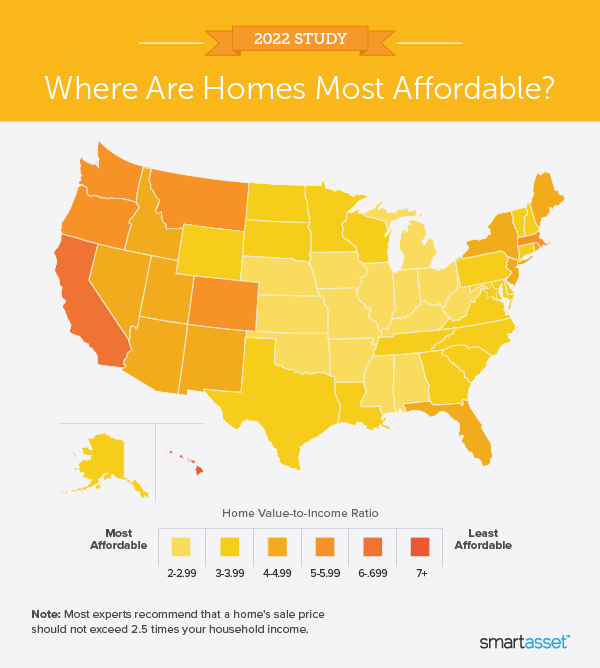
Where Are Homes Most Affordable?
In 13 states, the home value-to-income ratio is between 2.5 and 3.0. Four of those states are in the South (West Virginia, Arkansas, Mississippi and Alabama) and nine of them are in the Midwest (Iowa, Oklahoma, Kansas, Ohio, Indiana, Kentucky, Nebraska and Michigan).
The majority of states (29) have a home value-to-income ratio between 3.0 and 5.0. Meanwhile, in seven states and the District of Columbia the 2020 home value-to-income ratio exceeds 5.0. They seven states include Hawaii, California, Oregon, Washington, Colorado, Montana and Massachusetts.
The home value-to-income ratio is highest – and least favorable for home buyers – in Hawaii, at 7.74. The average home costs close to $668,674 and the median household income stands at roughly $86,391. The District of Columbia and California both have home value-to-income ratios of around 6.85, almost three times higher than the recommended average.
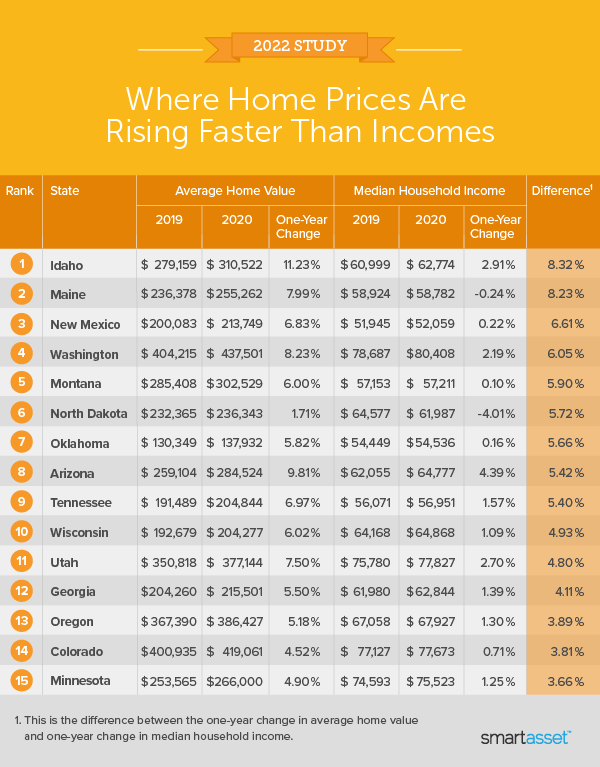
Where Home Prices Are Rising Faster Than Incomes
From 2019 to 2020, the average home value grew about 8% faster the median household income in Idaho – the largest difference in rates across all 50 states and the District of Columbia. The average home value rose by more than 11%, from roughly $279,200 to about $310,500. Meanwhile, Census Bureau data shows that the median household income increased only 2.91% from about $61,000 to close to $62,800.
Over the last year, home prices also grew significantly more than incomes in Maine, New Mexico and Washington. In all three states, average home values grew by upwards of 6% between 2019 and 2020. Meanwhile, Washington saw the largest increase in median household income, at 2.19%.
The average home value grew at a rate 5% faster than the median household income in five additional states. They include Montana, North Dakota, Oklahoma, Arizona and Tennessee. Of those, Montana has the highest 2020 home value-to-income ratio, at 5.29 – seventh-worst across all 50 states and the District of Columbia. The table below shows the 15 states where home prices grew fastest relative to incomes.
Data and Methodology
To measure home affordability and find where home prices are rising faster than incomes, we looked at data for all 50 states and the District of Columbia. Specifically, we examined data for the following metrics:
- Average home value. Data comes from Zillow and is for 2019 and 2020.
- Median household income. Data comes the Census Bureau’s 2019 and 2020 1-year American Community Survey.
To determine the states where homes are most and least affordable, we calculated the home vale-to-income ratio in 2020. A lower ratio indicates that homes are more affordable for the average household while a higher ratio indicates homes are less affordable.
To see where home prices are rising faster than incomes, we calculated the one-year percentage change in average home value and one-year percentage change in median household income. We then found the difference between those one-year changes. A higher difference indicates that homes prices are rising faster than incomes.
Home-Buying Tips
- Mortgage management. It is important to know when purchasing a home what you’ll be paying each month and for how long. To get a sense of what that might look like, check out SmartAsset’s free mortgage calculator.
- Buy or rent? Even if you have the savings to buy a first home, be sure the switch makes sense. If you are coming to a city and plan to stay for the long haul, buying may be the better option for you. On the other hand, if your stop in a new city will be a short one, you’ll likely want to rent. SmartAsset’s rent vs. buy calculator can help you see the cost differential between purchasing a home or apartment and renting.
- Seek out trusted advice. No matter where you live, a financial advisor can help you get your financial life in order. Finding a qualified financial advisor doesn’t have to be hard. SmartAsset’s free tool matches you with up to three financial advisors in your area, and you can interview your advisor matches at no cost to decide which one is right for you. If you’re ready to find an advisor who can help you achieve your financial goals, get started now.
Questions about our study? Contact us at press@smartasset.com
Photo credit: ©iStock.com/SDI Productions