 Written by
Though the Equal Pay Act (EPA) passed in 1963, pay equity issues still exist. According to the Bureau of Labor Statistics (BLS), in 2020, women made 82 cents for every dollar a man earned. Depending on race and ethnicity, this figure varies. Asian women earn 79 cents on the dollar compared to Asian men and Black women have median earnings that are 92% of Black men’s. Recently, the U.S. Women’s National Team (USWNT) made headlines for settling their equal pay dispute with the U.S. Soccer Federation: a dispute that pushed the conversation around the wage gap back into the spotlight.
Using data from the Equal Employment Opportunity Commission (EEOC)’s Enforcement and Litigation Statistics from 2011 to 2020, we explored the impact of the Equal Pay Act over the past 10 years. More specifically, we looked at how many charges of equal pay discrimination have been filed, the states where equal pay allegations are most prevalent and how allegations are typically resolved. For more information on our data sources, read our Data and Methodology section below.
Key Findings
- Since 2011, the number of equal pay allegations has stayed constant. Gross numbers for charges filed with the EEOC have hovered within the same range for the past 10 years (between 900 to 1,200 allegations), totaling 10,165 charges. The fewest number of charges (919) occurred in 2011 while 2019 had the most (1,117).
- Five of the 10 worst states for equal pay allegations are in the South. They include Alabama, Arkansas, Tennessee, Mississippi and Georgia. In all five states, the total number of equal pay charges filed from 2011 to 2020 per 100,000 workers exceeds 10.
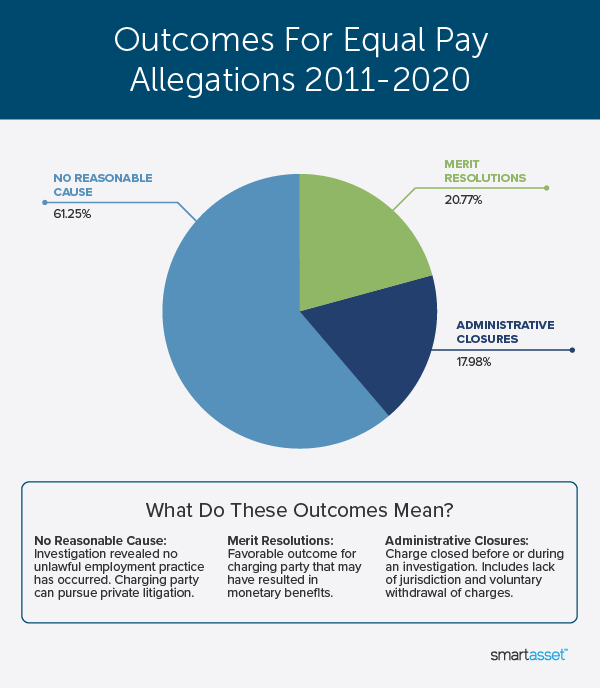
- Overall, one in five resolutions end with a favorable outcome for the charging party. Referred to as a merit resolution, this outcome may result in monetary benefits for the individual filing. Of the remaining resolutions, 61.4% of investigations find no reasonable cause and 17.1% end in administrative closures.
Where Are Equal Pay Allegations Most Prevalent?
Taking a deeper look at data for all 50 states and the District of Columbia over the past 10 years, the District of Columbia ranked worst for the number of equal pay allegations per 100,000 employed persons (30.6). The nation’s capital is followed by Alabama (23.3), New Mexico (22.6), Alaska (16.1) and Arkansas (15.3). The states with the lowest number of EPA charges per 100,000 workers since 2011 are Montana (0.8), Idaho (0.8), Iowa (1.0), Massachusetts (1.3) and Rhode Island (1.5).
Of the most populous states in the U.S., four of them rank within the 15 worst states: Georgia (ninth-worst), North Carolina (13th-worst), Illinois (14th-worst) and Pennsylvania (15th-worst). In gross terms and since 2011, upwards of 250 equal pay allegations have been reported in all 10 most populous states. At 993 charges, Texas has the highest number of charges filed.

Outcomes for Equal Pay Allegations
After an allegation has been filed with the EEOC, a resolution usually occurs within 180 days. In general, the types of resolutions are sorted into three main categories: investigation found no reasonable cause, the charge was closed for administrative reasons or a favorable outcome for the charging party. Over the past 10 years, at least 56.91% of all resolutions were dismissed when the investigation found no reasonable cause. Administrative closures accounted for between 16.16% (in 2017) to 23.14% (in 2013) of resolutions and favorable outcomes to the charging party accounted for between 18.69% (in 2017) to 24.58% (in 2012) of resolutions.
Since 2011, the number of resolutions investigations that found no reasonable cause has increased by 6.53%. Administrative closures have also increased by 5.41%. Resolutions in which the charging party had a favorable outcome has decreased by 4.28%.
Data and Methodology
Data for this report comes from the Equal Employment Opportunity Commission (EEOC)’s Enforcement and Litigation Statistics and the Census Bureau’s 2020 1-year American Community Survey. To calculate Equal Pay Act (EPA) charges per capita, we summed the number of allegations from 2011 to 2020 and adjusted that sum to be for 100,000 employed workers over the age of 16.
Tips for Maximizing Your Paycheck
- Set up a budget. Whether or not you receive a pay raise or work with your current income. We have the tools to help gain financial control. Our paycheck calculator can help you calculate the difference in your take-home pay and our budget calculator can give you a clear picture of your current spending. Visualize the next six months and learn where cutting back on excess expenses can maximize your savings.
- Work with a professional. A financial advisor can help you make the most of your money. SmartAsset’s free tool matches you with up to three financial advisors who serve your area, and you can interview your advisor matches at no cost to decide which one is right for you. If you’re ready to find an advisor who can help you achieve your financial goals, get started now.
get started now.
Questions about our study? Contact press@smartasset.com.
Photo credit: © iStock/AndreyPopov