 Written by
Nationally, unemployment has slowly fallen since its initial record spike in April as a result of the COVID-19 pandemic. The Bureau of Labor Statistics (BLS) reported last month that the national August 2020 unemployment rate was 8.4%. More recently, on Wednesday, September 30, the BLS released metro area unemployment rates for August 2020. The data shows a wide range of unemployment rates across the U.S., suggesting that workers in some areas are struggling more than others – which in turn affects their ability to meet their expenses and save adequately for other financial goals.
In this study, we examined unemployment across the 389 U.S. metro areas. We identified the places with the highest and lowest August 2020 unemployment rates and determined where unemployment has risen the most relative to pre-pandemic levels. For details on our data sources and how we put the information together to create our final rankings, check out the Data and Methodology section below.
Key Findings
- In almost one in 10 metro areas, unemployment is less than 5%. Though the national August 2020 unemployment rate stood at 8.4%, workers in many metro areas have been less affected. In 37 metro areas of the total 389, less than one in 20 workers is unemployed.
- In four metro areas, unemployment remains at least 10 percentage points higher than it was prior to COVID-19. They include Kahului-Wailuku-Lahaina, Hawaii; Las Vegas-Henderson-Paradise, Nevada; Atlantic City-Hammonton, New Jersey and Los Angeles-Long Beach-Anaheim, California. Of these four metro areas, Atlantic City-Hammonton had the highest February 2020 unemployment rate, at 6.4%. By comparison, Kahului-Wailuku-Lahaina had the highest August 2020 unemployment rate, at 20.7%.
- Unemployment decreased in just three metro areas. Across the board, August 2020 unemployment is higher than it was prior to COVID-19, except for in three metro areas. Unemployment is lower now than it was earlier this year in Ocean City, New Jersey; Salinas, California and Sierra Vista-Douglas, Arizona by 1.0, 0.6 and 0.2 percentage points, respectively.
Where August 2020 Unemployment Is Highest and Lowest
As of mid-August 2020, unemployment exceeded 20% in two metro areas – El Centro, California and Kahului-Wailuku-Lahaina, Hawaii. El Centro is located on the southern border of California and Kahului-Wailuku-Lahaina in Maui County in Hawaii. El Centro has historically had relatively high unemployment, though Kahului-Wailuku-Lahaina’s recent rate represents a significant increase from the pre-pandemic rate.
Unemployment is additionally 15% or more in four other metro areas – Atlantic City-Hammonton, New Jersey; Yuma, Arizona; Las Vegas-Henderson-Paradise, Nevada and Los Angeles-Long Beach-Anaheim, California. The table below shows the 11 metro areas with the highest August 2020 unemployment rates. In all 11 places, unemployment is at least 4.6 percentage points higher than the August 2020 national rate.
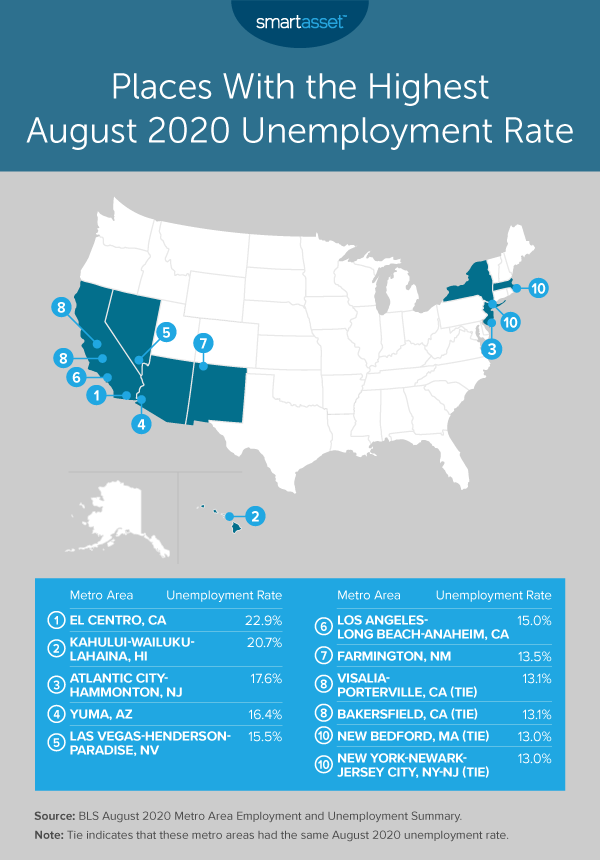
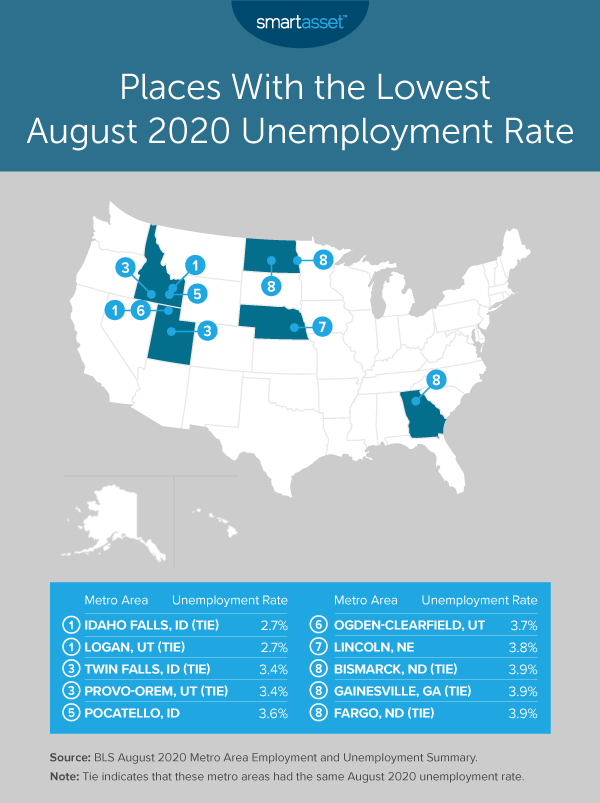
Though many areas are struggling, some places have maintained relatively low unemployment levels. The August 2020 unemployment rate is the lowest in Idaho Falls, Idaho – at 2.7%. In nine other places, the rate is also lower than 4%. All 10 places are highlighted on the map below.
Where August 2020 Unemployment Is Highest Compared to Pre-Coronavirus Levels
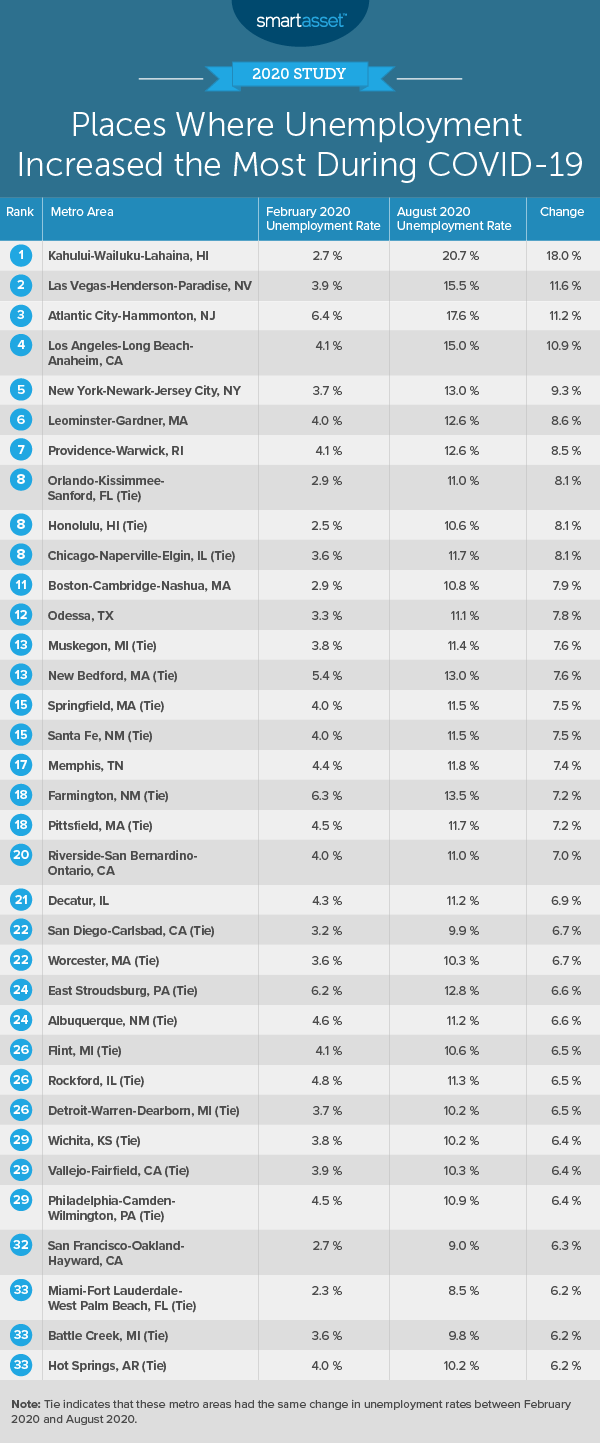
In a previous study, we looked at the difference in February and April 2020 unemployment rates. With more recent data available, we investigated where unemployment remains the most elevated relative to February 2020 rates. Kahului-Wailuku-Lahaina, Hawaii sits at the top of the list. Its August 2020 unemployment rate of 20.7% is 18.0 percentage points higher than it was in February 2020. This percentage-point increase marks roughly 14,600 newly unemployed workers in the area.
In nine additional metro areas, August 2020 unemployment is more than eight percentage points higher than it was in February 2020. Of those, New York-Newark-Jersey City, New York has the highest total current number of unemployed workers. Though the metro area ties for just the sixth-highest unemployment rate in August, at 13.0%, its high population density means that 1.3 million workers in the area are currently out of a job. This is almost 923,000 more than were out of work prior to COVID-19. The table below shows the 35 metro areas with the most elevated August 2020 unemployment rates relative to February 2020.
Data and Methodology
Data for this report comes from the Bureau of Labor Statistics’ Metropolitan Area Employment and Unemployment Summary. The first section ranks metro areas according to their August 2020 unemployment rate alone. The second section looks at the percentage-point difference between February 2020 and August 2020 unemployment rates. We ranked metro areas from those with the largest difference to those with the smallest.
Tips for Making it Through the COVID-19 Recession
- Build your emergency savings when possible. The pandemic, with the devastating unemployment numbers that it has wrought, has highlighted the importance of building an emergency fund when possible to prepare for periods without work. Though typical financial wisdom suggests you should have savings that can cover three months’ worth of expenses, six months’ may be a better figure to shoot for during a recession. Check out our budget calculator to see how much you spend each month and how cutting back on discretionary expenses can increase your savings rate.
- Consider talking to a financial advisor about how to ride out a financial downturn. If you are nervous about your retirement account or what to do with money you are making, talking to a financial advisor might not be a bad idea. Finding the right financial advisor who doesn’t have to be hard. SmartAsset’s free tool matches you with financial advisors in your area in five minutes. If you’re ready to be matched with local advisors that will help you achieve your financial goals, get started now.
Questions about our study? Contact us at press@smartasset.com
Photo credit: ©iStock.com/courtneyk