 Written by
Almost one in two Americans (48%, to be exact) prefer to live in a town or rural area, according to a 2020 Gallup survey – up from 39% in 2018. And while 27% still say that they want to live in a city, almost two-thirds of that group (16%) prefer a small city to a big one. The coronavirus crisis has also made places with low population densities more appealing, and small cities can offer the energy and creativity of urban life while boosting your savings in an affordable community. SmartAsset compared almost 300 cities with populations between 65,000 and 100,000 to identify and rank the most livable small cities in our 2021 study.
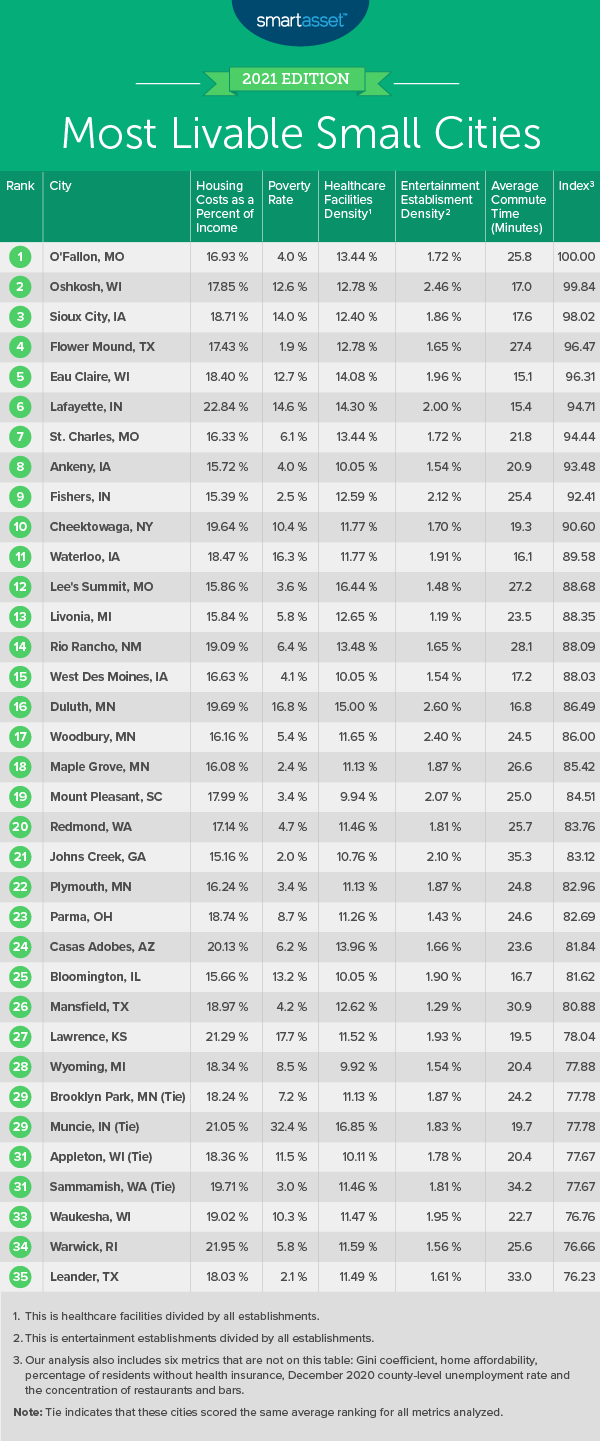
We analyzed data from 291 cities across the following metrics: concentration of entertainment establishments, restaurants, bars and healthcare establishments, Gini coefficient (a measure of income inequality), home affordability, housing costs as a percentage of median income, percentage of residents below the poverty line, unemployment rate percentage of residents without health insurance and average commute time. For details on our data sources and how we put all the information together to create our final rankings, check out the Data and Methodology section below.
This is SmartAsset’s fourth study on the most livable small cities. Read the 2020 study here.
Key Findings
- Midwest ranks at the top. Eight out of the top 10 cities in this study are located in Midwestern states, with two in Missouri, two in Wisconsin, two in Indiana and two in Iowa. All eight of these cities rank within the top 70 (out of a total 291) for strong home affordability and within the top 60 of all cities for their low Dec. 2020 unemployment rate. The other two spots in the top 10 are claimed by cities in New York and Texas.
- Unemployment tracks nationally. In December 2020, the national unemployment rate was 6.7%. That’s the exact same as the average unemployment rate in the small cities we analyzed for this survey, so living in a small city doesn’t appear to be a major factor when it comes to the availability of work. The lowest unemployment rate we found was 2.1% in Ames, Iowa.
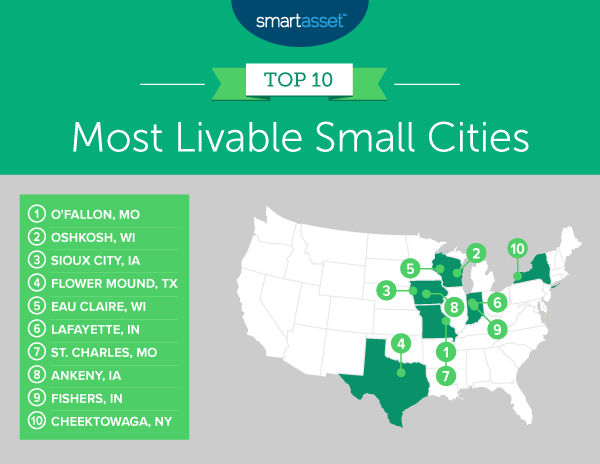
1. O’Fallon, MO
Just over 30 miles away from St. Louis, O’Fallon, Missouri leads our study as the most livable small city in America. The city ranks 11th for low income inequality, with a Gini coefficient of 0.36. In addition, it ranks 30th for its relatively low proportion of residents living below the poverty line, at 4.0%. Median housing costs equal just 16.93% of median household income in O’Fallon, ranking 19th for that metric in the study overall.
2. Oshkosh, WI
Oshkosh, Wisconsin is located 75 miles from Milwaukee and ranks 15th in our study for home affordability with a 2.39 ratio of home value to household income. County-level data shows that Winnebago County, where Oshkosh is located, has the highest concentration in the study of bars compared to all establishments (2.63%) and ranks 20th for entertainment establishments compared to all establishments (2.46%).
3. Sioux City, IA
Sioux City, Iowa ranks 11th for home affordability with a 2.25 ratio of home value to household income. This city also has the 14th-lowest unemployment rate in our study, at 3.4% in December 2020. According to county-level data, it also has the 11th-highest concentration of bars (1.29%).
4. Flower Mound, TX
Only 1.9% of Flower Mound residents live beneath the poverty line, the third-lowest rate for this metric in our study. The county in which this Texan city is located has the 14th-highest concentration of restaurants, 9.07% of all establishments. Median housing costs equal 17.43% of median household income in Flower Mound, the 21st-lowest ranking for this metric.
5. Eau Claire, WI
Eau Claire, Wisconsin has the third-highest concentration of bars in our study, at 1.89% of all establishments at the county level, and the third-fastest commuting time with an average length of 15.1 minutes. Eau Claire also ranks 22nd out of 291 for its high number of healthcare establishments, at 14.08% of all establishments.
6. Lafayette, IN
Lafayette, Indiana has the 13th-highest concentration of restaurants, at 9.13% of all establishments at the county level. This city also ranks 15th for its high concentration of healthcare facilities, at 14.30% of all establishments. But 14.6% of the residents in Lafayette live below the poverty line, ranking 200th out of all 291 cities we analyzed.
7. St. Charles, MO
Median housing costs amount to 16.33% of median household income in St. Charles, Missouri, ranking 15th in the study. St Charles has the 39th-highest concentration of healthcare establishments at the county level (13.44%) and the 55th-lowest Dec. 2020 unemployment rate (4.7%) – both top quintile rankings.
8. Ankeny, IA
Median housing costs in Ankeny, Iowa equal 15.72% of median household income, the seventh-lowest rate for this metric in the study. This city ranks 14th for its relatively high concentration of bars, making up 1.04% of all establishments, according to county-level data. But ranks 215th for its concentration of restaurants, which account for only 6.72% of all establishments at the county level.
9. Fishers, IN
Median housing costs equal 15.39% of median household income in Fishers, Indiana, ranking fifth for this metric out of all 291 cities we studied. The city had the second-lowest unemployment rate in the study, with just 2.7% in Dec. 2020. And only 2.5% of its residents live below the poverty line, 11th-lowest in this study.
10. Cheektowaga, NY
Cheektowaga, New York has a 7.6% unemployment rate for Dec. 2020 (the highest rate for this metric in the top 10). Despite this, only 3.3% of residents are uninsured (29th-lowest rate for this metric out of 291). Cheektowaga also ranks 19th for home affordability, with a 2.43 ratio of home value to household income.
Data and Methodology
To find the most livable small cities in America, SmartAsset compared 291 cities with at least 65,000 people but fewer than 100,000 across the following 11 metrics:
- Concentration of entertainment establishments. This is the number of arts, entertainment and recreation establishments as a percentage of all establishments in a county. Data comes from the U.S. Census Bureau’s 2018 County Business Patterns Survey.
- Concentration of bars. This is the number of bars as a percentage of all establishments in a county. Data comes from the U.S. Census Bureau’s 2018 County Business Patterns Survey.
- Concentration of restaurants. This is the number of restaurants as a percentage of all establishments in a county. Data comes from the U.S. Census Bureau’s 2018 County Business Patterns Survey.
- Concentration of healthcare establishments. This is the number of healthcare and social assistance establishments as a percentage of all establishments in a county. Data comes from the U.S. Census Bureau’s 2018 County Business Patterns Survey.
- Gini coefficient. This is a statistical measurement of income inequality. A Gini coefficient of zero indicates total equality of wealth distribution, while a coefficient of one indicates total inequality of wealth distribution across groups. Data comes from the U.S. Census Bureau’s 2019 1-year American Community Survey.
- Home affordability. This is the median home value divided by median household income. A lower ratio indicates that homes are more affordable and vice versa. Data comes from the U.S. Census Bureau’s 2019 1-year American Community Survey.
- Housing costs as a percentage of household income. This is the median housing costs divided by median household income. Data comes from the Census Bureau’s 2019 1-year American Community Survey.
- Percentage of residents below the poverty line. Data comes from the U.S. Census Bureau’s 2019 1-year American Community Survey.
- Unemployment Rate. Data comes from the Bureau of Labor Statistics and is for December 2020. This is measured at the county level.
- Percentage of residents without health insurance. Data comes from the U.S. Census Bureau’s 2019 1-year American Community Survey.
- Average commute time. This measures a worker’s average commute time in minutes. Data comes from the U.S. Census Bureau’s 2019 1-year American Community Survey.
First, we ranked each city in each metric. Next, we found each city’s average ranking, with each metric receiving an equal weight. We used this average ranking to create our final scores. The city with the highest average ranking received a score of 100 and the city with the lowest average ranking received a score of 0.
It is important to note that our 2020 study on the most livable small cities in the U.S. did not include one of the metrics we used this year – the unemployment rate in each city. Due to the drastic changes in unemployment at the onset of the coronavirus pandemic, we decided to exclude that metric from last year’s analysis. We added it back into the equation for this year and considered the most recently available figures from the BLS, measured at the county level.
Tips for Managing Your Finances No Matter Where You Live
- Professional advice can help you make the right moves. Interested in moving to one of these cities? A financial advisor can help you create a financial plan to reach your goals. SmartAsset’s free tool matches you with financial advisors in five minutes. If you’re ready to be matched with advisors that might be able to help you achieve your financial goals, get started now.
- Forecast your mortgage costs. Buying a home is a serious proposition, and you need to make sure you are prepared. Use SmartAsset’s free mortgage calculator to see what your monthly payments could end up being.
- Get a snapshot of your retirement timeline. For some people, work demands mean being in a big city for most of their career. In retirement, though, you may want to live a slower-paced life in a small city. Make sure you’re using a 401(k) or any other workplace retirement plan you have access to so that your retirement dreams can come true.
Questions about our study? Contact press@smartasset.com.
Photo Credit: © iStock/DenisTangneyJr