 Written by
When buying nourishing food, it’s also important to sustain healthy budgeting and savings habits. Of course, how much you’ll spend on what you eat depends largely on where you live. Food has varying costs in different markets based on a lot of different factors, including the cost of shipping food to that location, the overall cost of living and the local economy. Knowing how much food costs in your area is key to determining your budget and how much you put in your savings account, as you have to balance the cost of food with other costs like housing, transportation and leisure activities, all while making sure not to spend above your means.
Below, SmartAsset figured out where people spend the highest percentage of their total income on food. We analyzed data for 22 metro areas across two metrics: average food spending and average household income. For further details about our data sources and how we put it all together to create our final rankings, see the Data & Methodology section below.
Key Findings
- Eating on the go? Five of the cities that are on our list of the top 10 places where people spend the most on food also made it into the top 10 for our study on places where people spend the most on transportation: Los Angeles, California; Houston, Texas; Tampa, Florida; Baltimore, Maryland and St. Louis, Missouri. In these locales, eating and commuting are taking a larger bite out of people’s budgets.
- Geography isn’t a major factor. There isn’t a single region that dominates this top 10. Representatives are distributed fairly evenly: Four top-10 contenders are from states in the Western region of the country, three are from states in the South and three are from states in the Midwest.
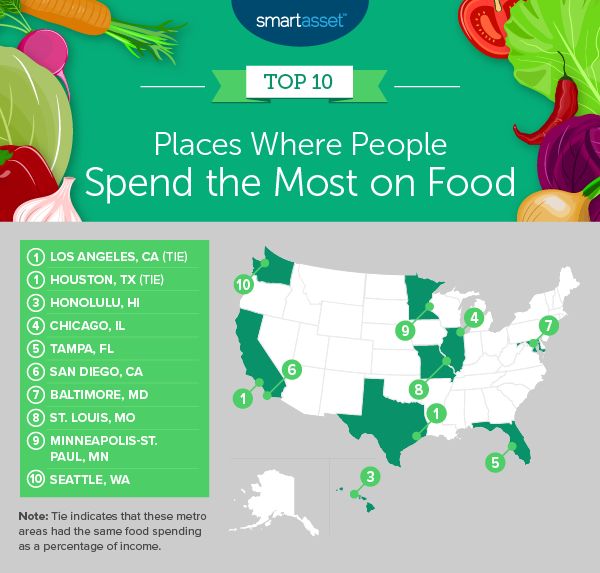
1. Los Angeles, CA (tie)
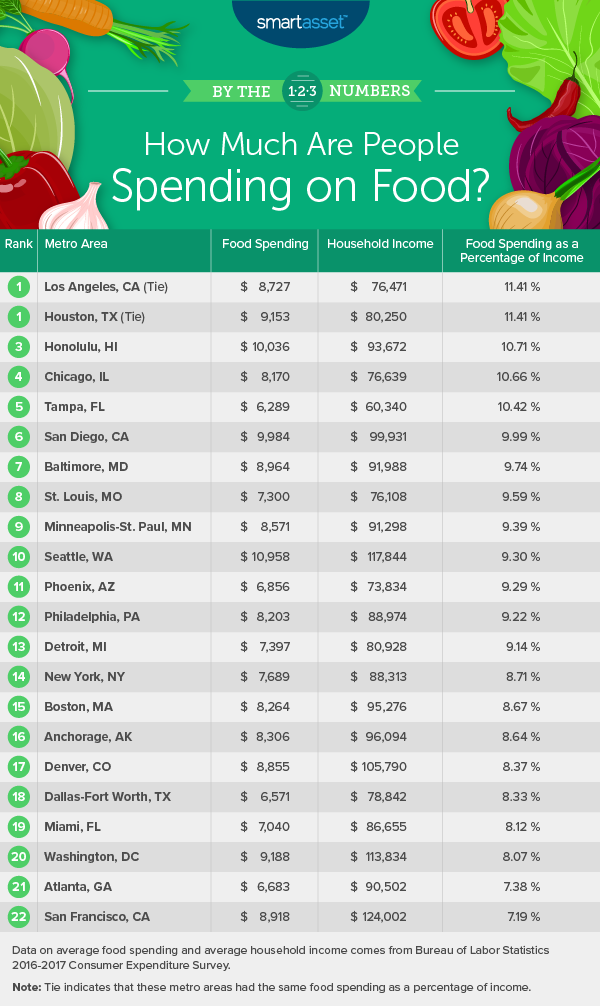
The top locale on our list is Los Angeles, California, where the average household spends 11.41% of its annual income on food. With an average household income of $76,471, total food spending comes to $8,727 per year. Residents here may need to be particularly disciplined with their budgets to try to reduce their food expenditures.
1. Houston, TX (tie)
Houston, Texas, ties with Los Angeles for the No. 1 spot. Houstonians also spend 11.41% of their total income on food. A higher average income, though, means the raw dollars total is higher than in LA at $9,153.
3. Honolulu, HI
Food often has to be transported to the Hawaiian Islands, so it makes sense that Hawaii’s capital of Honolulu would have high food costs. The average household there spends about $10,036 a year, the second-highest raw total on this list, which translates to 10.71% of its income. The delicious poke may be worth the extra cost, but it’s important for saving-conscious residents of Hawaii to keep their cost-of-living in check.
4. Chicago, IL
Chicago, Illinois ranks fourth in our study. Residents of the Windy City spend 10.66% of their income on food, including all those Chicago-style hot dogs. Average annual household income in Chicago, at $76,639, is the fifth-lowest amount for this metric in our study.
5. Tampa, FL
We go to Tampa, Florida to round out the top five. Residents of Tampa spend an average of $6,289 a year on food. This amounts to 10.42% of their average annual household income.
6. San Diego, CA
San Diego, California takes the sixth spot on our list. Residents of this Navy town in Southern California spend, on average, $9,984 on food each year, or 9.99% of their income. For those looking to rein in their grocery bills and find extra savings to invest, a fiduciary financial advisor can help.
7. Baltimore, MD
On the other side of the country, Baltimore, Maryland denizens spend $8,964 on food, including the steamed blue crabs. That’s 9.74% of their yearly income.
8. St. Louis, MO
In St. Louis, Missouri, residents spend $7,300 per year on food, representing 9.59% of an average annual household income of $76,108, which is the third-lowest income amount in the study overall.
9. Minneapolis-St. Paul, MN
Holding the second-to-last spot in our list, the locals in Minneapolis-St. Paul, Minnesota are spending 9.39% of their income on food, for a total of $8,571.
10. Seattle, WA
Seattle, Washington rounds out the top 10 overall, but it has the highest raw total for amount spent annually on food, at $10,958. A high average income, though, means that is just 9.30% of residents’ paychecks each year.
Data and Methodology
In order to find the places where people spend the most on food, we looked at data for all 22 metro areas included in the Bureau of Labor Statistics 2016-2017 Consumer Expenditure Survey. Specifically, we looked at data for the following metrics:
- Average food spending. This is the annual amount that the average household spends on food (including food at home and food away from home). Data is from the Bureau of Labor Statistics 2016-2017 Consumer Expenditure Survey.
- Average household income. This is the annual average household income. Data is from the Bureau of Labor Statistics 2016-2017 Consumer Expenditure Survey.
We divided the average food spending in each metro area by the average household income in that area. The result represents the average food spending as a percentage of total income. We ranked the places according to those percentages, from highest to lowest.
Tips for Managing Your Spending
- Balance your diet but also your budget. A budget is key to responsible spending. Are you spending more than you need to on food or some other expense? Use SmartAsset’s budget calculator to help you figure it all out.
- Don’t let research eat up your time. Looking for some advice with your finances? Why start from scratch? A professional advisor can help you plan your spending. Find one with SmartAsset’s free financial advisor matching service. You answer a short questionnaire and we match you with up to three advisors, all fully vetted and free of disclosures. You talk to each advisor, ask questions and decide how you want to proceed.
Questions about our study? Contact us at press@smartasset.com
Photo credit: ©iStock.com/FatCamera