 Written by
Many economists have theorized about what the shape of the COVID-19 recession – in other words, the possibilities for recovery – will be. Some individuals are still holding out hope for a “V-shaped” recession where the economy will rebound as quickly as it declined, which would in turn allow many to begin to repair the dents suffered to their reserves. Given the current circumstances, however, the odds that such an optimistic forecast will become reality have decreased. As infection rates spike throughout the country, local governments may decide to reimplement business shutdowns and stay-at-home orders.
One way to visualize the recession’s shape thus far is to examine consumer spending. Consumer spending accounts for roughly 68% of U.S. GDP, and thus drastically impacts the length and severity of a recession. In this study, SmartAsset took a closer look at consumer spending in the U.S. during COVID-19.
Specifically, we looked at how consumer spending has contracted nationally over the past several months and the extent to which spending has since recovered. We additionally discuss the spending categories that have been the most affected as well as cities where consumer spending has recovered the most. For details on our data sources and how we put all the information together to create our final rankings, check out the Data and Methodology section below.
Key Findings
- Consumer spending cuts during COVID-19 differ from previous recessions. Research shows that during previous recessions, spending on services has remained essentially unchanged while spending on durable goods tends to take a larger hit. For instance, during the Great Recession, personal consumer expenditures on services fell by less than 1% between 2007 and 2009, while spending on durable goods fell by about 10% over the same time period. Thus far during COVID-19, the story has been very different, with services spending contracting sharply while durable goods spending has remained steadier.
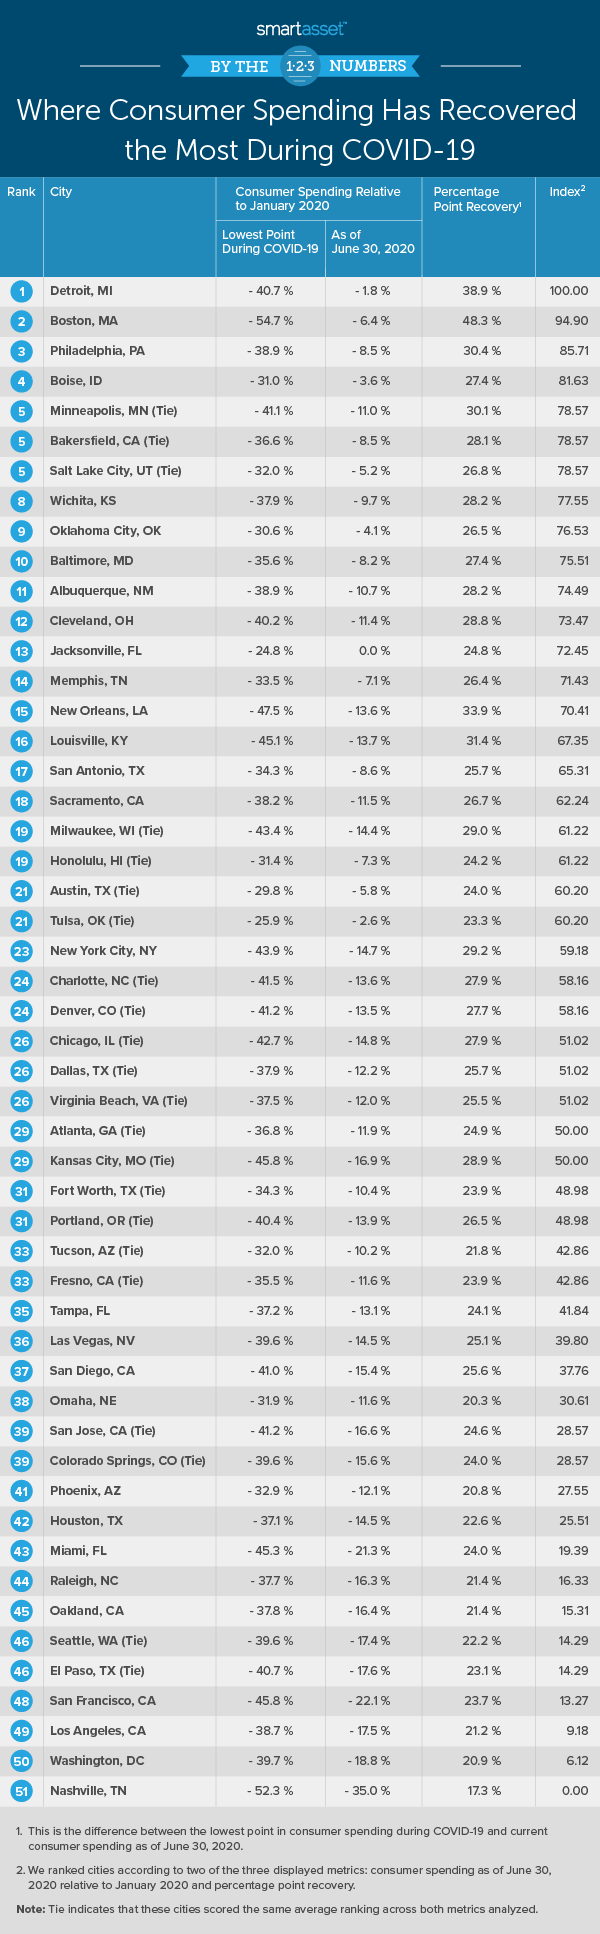
- Recoveries in consumer spending by city vary significantly. As of June 30, 2020, total consumer spending in Jacksonville, Florida was the same as it was in January 2020 (though spending here dropped less than it did in other major cities nationwide). By contrast, consumer spending in Nashville, Tennessee at the end of June was still 35.0% less than average spending in January 2020.
- Thus far, California cities have seen some of the slowest recoveries of consumer spending. California’s two largest cities – Los Angeles and San Francisco – both rank in the bottom five cities in our study. In both cities, consumer spending as of the end of June was still roughly 20% lower than it was in January. Four additional California cities also rank in the bottom half of the study: Oakland, San Jose, San Diego and Fresno.
A Look at National Consumer Spending
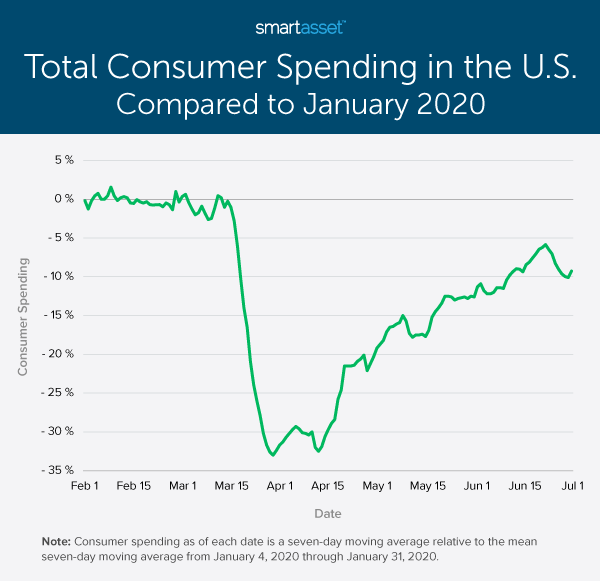
Nationally, consumer spending bottomed out in the last week of March 2020, about two weeks after the White House declared a national emergency concerning COVID-19. On March 30, the seven-day moving average (a technical indicator used to analyze trends) for credit/debit card spending was 33.00% lower than the mean seven-day moving average in January. Since then, consumer spending has somewhat normalized. As of the end of June, total consumer spending was about 9% lower than it was in January. The chart below shows the progression of consumer spending in the U.S. during COVID-19 relative to its pre-crisis levels.
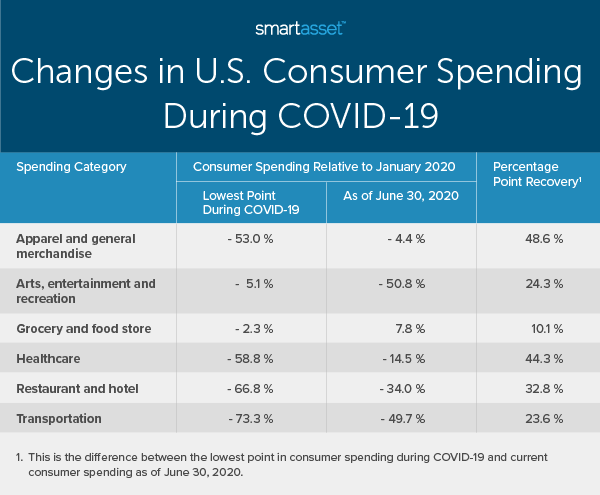
Spending cuts during COVID-19 have been concentrated in specific categories. Arts, entertainment and recreation spending saw the biggest shock in the U.S., hitting its lowest levels in mid-April. Additionally, transportation spending has also been significantly affected with individuals limiting their professional and personal travel. In contrast, grocery and food store spending remained steady throughout the peak weeks of the crisis. The table below shows the lowest point in consumer spending for each spending category, June 2020 consumer spending and the percentage point difference between the lowest point in consumer spending and June 2020 consumer spending. Consumer spending for both the lowest point and June 2020 is represented as percentages relative to average spending in January 2020.
Where Consumer Spending Has Recovered the Most
SmartAsset analyzed data for 51 of the largest U.S. cities to identify where consumer spending has recovered the most. Specifically, we ranked cities according to two metrics: consumer spending as of June 30, 2020 relative to average spending in January 2020, as well as percentage point recovery (i.e. the difference between the lowest point in consumer spending during COVID-19 and consumer spending as of June 30, 2020).
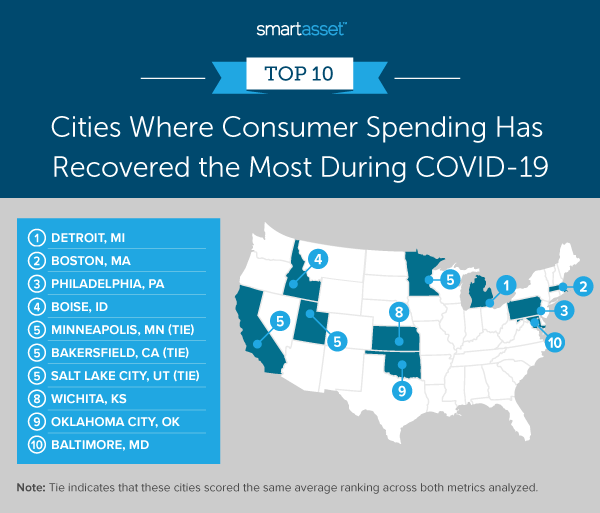
1. Detroit, MI
Total consumer spending in Detroit, Michigan hit its lowest point on March 30, 2020, according to our data. As of that date, the seven-day moving average was more than 40% lower than pre-coronavirus levels. Despite that fallout, consumer spending at the end of June 2020 was almost back to normal. The seven-day moving average for credit/debit card spending on June 30, 2020 was only 1.8% lower than average spending in January 2020. This means that consumer spending recovered close to 39 percentage points from its lowest point through the end of June.
2. Boston, MA
Boston, Massachusetts has the eighth-highest June 2020 consumer spending relative to average spending in January 2020 and the highest percentage point recovery in our study. As of June 30, 2020, total spending by all consumers was 6.4% lower than it was in January 2020. This figure marks a 48.3 percentage point recovery from the lowest point in consumer spending relative to average spending in January 2020, at -54.7%.
3. Philadelphia, PA
Philadelphia, Pennsylvania ranks as the third city where consumer spending has recovered the most during COVID-19. There is a more than 30 percentage point difference between its lowest point in consumer spending relative to average spending in January 2020 (-38.9%) and June 2020 consumer spending relative to average spending in January 2020 (-8.5%).
4. Boise, ID
Boise, Idaho saw a smaller shock to consumer spending during COVID-19 than most other cities in our study. The lowest point in consumer spending relative to average spending in January 2020 was -31.0%. Boise has also recovered relatively well. As of June 30, 2020, total consumer spending was only about 3.6% less than average spending in January 2020.
5. Minneapolis, MN (tie)
June 2020 consumer spending in Minneapolis, Minnesota (-11.0% relative to pre-crisis levels) is the lowest of any city in our top 10, but Minneapolis ranks well on our other metric: its percentage point recovery. Specifically, with spending reaching -41.1% at its lowest point, it has since recovered 30.1 percentage points.
5. Bakersfield, CA (tie)
Bakersfield, California has the 12th-highest June 2020 consumer spending in the study. Furthermore, it has the 13th-highest percentage point recovery in the study (i.e. the difference between its lowest point in consumer spending and June 2020 consumer spending). As of June 30, 2020, consumer spending was 8.5% lower than it was in January 2020, and from its low of -36.6%, consumer spending recovered by more than 28 percentage points.
5. Salt Lake City, UT (tie)
Salt Lake City, Utah ties with Minneapolis, Minnesota and Bakersfield, California for the No. 5 spot in the study. Though spending dropped less than the national average during the crisis in Salt Lake City, consumer spending by city residents has recently been closer to pre-pandemic levels than in many other places. The seven-day moving average for credit/debit card spending on June 30, 2020 was only 5.2% lower than the mean seven-day moving average in January 2020.
8. Wichita, KS
Wichita, Kansas has the 15th-highest June 2020 consumer spending and 11th-highest percentage point recovery in the study. From its lowest point, -37.9%, consumer spending in Wichita recovered by more than 28 percentage points to its June 2020 point of only -9.7% (compared to January 2020 levels).
9. Oklahoma City, OK
Oklahoma City, Oklahoma has the fifth-highest June 2020 consumer spending and 22nd-highest percentage point recovery across all 51 cities in the study. Consumer spending as of June 30, 2020 is 4.1% lower than in January 2020. This means that from its low of -30.6%, consumer spending recovered by more than 26 percentage points.
10. Baltimore, MD
Baltimore, Maryland rounds out our list of the top 10 cities where consumer spending has recovered the most during COVID-19. Consumer spending decreased by more than 35% during the pandemic, but as of June 30, 2020, the seven-day moving average was only 8.2% lower than the mean seven-day moving average in January 2020.
Data and Methodology
Data for this report comes from tracktherecovery.org, published by Opportunity Insights with support from Harvard University, Brown University and the Bill & Melinda Gates Foundation. The data comes from private companies, such as credit card processors and payroll firms, that Opportunity Insights partnered with to provide real-time insights on the economic impacts of COVID-19. In particular, consumer spending data comes from Affinity Solutions. Opportunity Insights collected data for 51 cities total, and we considered all of them.
For the purposes of anonymity and privacy, credit/debit card consumer spending data is not reported in terms of gross amounts, but rather as a percentage relative to average spending from January 4, 2020 through January 31, 2020. To find where consumers spending has recovered the most and least, we first ranked each city according to two metrics:
- June 2020 consumer spending. This is consumer spending as of June 30, 2020 relative to average consumer spending between January 4, 2020 and January 31, 2020.
- Percentage point recovery. This is the difference between the lowest point in consumer spending relative to January 2020 and June 2020 consumer spending.
We ranked each city in each metric. Giving an equal weighting to both metrics, we found each city’s average ranking. The city with the highest average ranking received a score of 100, ranking as the place where consumer spending has recovered the most. The city with the lowest average ranking received a score of 0, ranking as the place where consumer spending has recovered the least.
Tips for Protecting Your Finances During a Recession
- Have emergency savings. One of the best ways to prepare for the unknown is to have an emergency fund. It can help you weather periods of economic uncertainty and meagerness. Amid the current financial challenges the pandemic has exacted, those funds can prove vital. If you are able, even during tough times, to squirrel away some cash in your reserves, it will serve you when you’re most strapped for cash. Though typical financial wisdom suggests you should have savings that can cover three months’ worth of expenses, six months’ may be a better figure to shoot for during a recession.
- Consider talking to a financial advisor about how to ride out a financial downturn. If you are nervous about your retirement account or what to do with money you are making, speaking with an expert might not be a bad idea. Finding the right financial advisor that fits your needs doesn’t have to be hard. SmartAsset’s free tool matches you with financial advisors in your area in five minutes. If you’re ready to be matched with local advisors that will help you achieve your financial goals, get started now.
Questions about our study? Contact us at press@smartasset.com