 Written by
  Given that so many Americans were stuck indoors and without access to gyms during the height of the COVID-19 pandemic, those looking to burn some of those quarantine calories and stay healthy may look to running as a premier way to get some exercise. Road races may be less abundant, but those hankering to pound the pavement can maintain social distance measures through distance running. Of course, runners can incur a range of expenses – from buying new shoes to signing up for gym memberships and even purchasing a treadmill. So even as you mind your fitness, it’s important to watch your wallet too. But living in an area well-suited to running can help mitigate these costs and enable you to save more actively. To that end, SmartAsset analyzed factors such as the frequency of races, concentration of gyms, affordability and walkability to determine the best cities for runners nationwide.
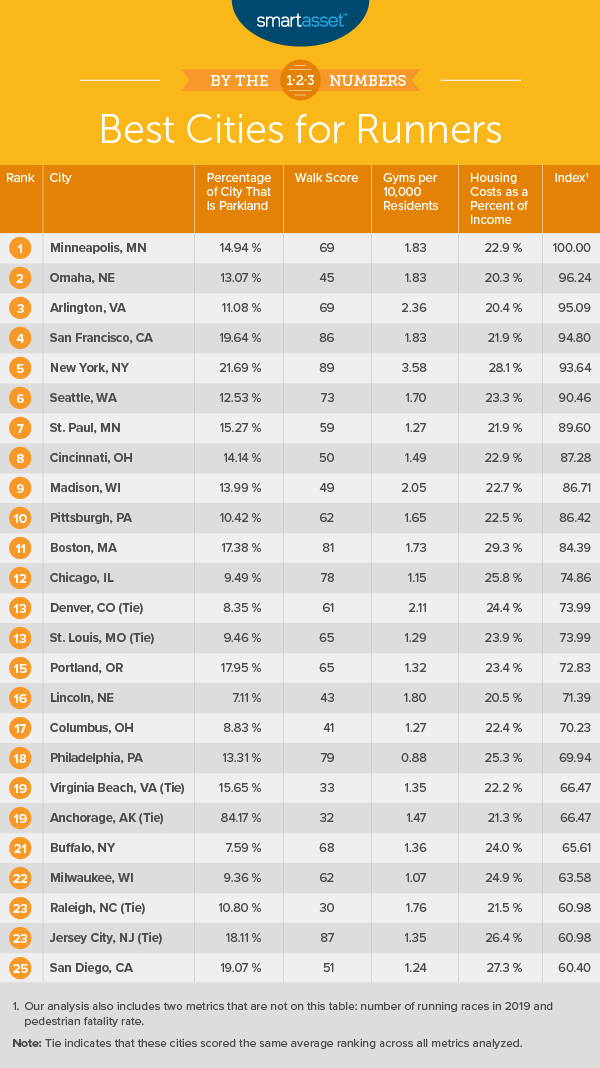
More specifically, we looked at data for 95 of the largest U.S. cities across the following six metrics: walk score, pedestrian fatality rate, number of gyms per 10,000 residents, number of races in 2019, percentage of the city that is parkland and housing costs as a percentage of income. For details on our data sources and how we put all the information together to create our final rankings, check out the Data and Methodology section below.
This is SmartAsset’s fourth study on the best cities for runners. Read the 2019 version here.
Key Findings
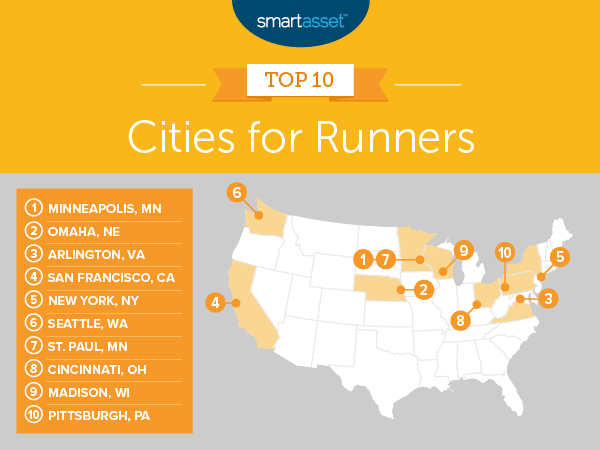
- Midwestern cities are popular for runners. Five of our top 10 cities for runners are in Midwestern states: Minneapolis, Minnesota; Omaha, Nebraska; St. Paul, Minnesota; Cincinnati, Ohio and Madison, Wisconsin. They rank first, second, seventh, eighth and ninth, respectively. All five rank within the best 30% of the study for the high percentages of parkland in their cities and within the best 15% for their low pedestrian fatality rates.
- Safety first. All cities in the top 10 but one (San Francisco, California) rank within the top 25 for their low pedestrian fatality rate. The average pedestrian fatality rate across the top 10 is about 1.18 per 100,000 residents.
1. Minneapolis, MN
Minneapolis, Minnesota, the No. 1 city for runners, has the lowest pedestrian fatality rate across all 95 cities we examined, with a rate of just 0.68 fatalities per 100,000 residents. Minneapolis also has 1.83 gyms per 10,000 residents, the seventh-highest amount for this metric in this study. In addition, the city had 53 races in 2019, ranking 12th-highest in the study for this metric. So whether you want to run competitively or just hit the treadmill, Minneapolis could work for you. And if you’re having trouble keeping your funds from running away from you as you manage your budget around these expenses, it might be worthwhile to speak to one of the many financial advisors who run their businesses in the Minneapolis area.
2. Omaha, NE
Omaha, Nebraska ranks in the top 10 for three of the six metrics we considered: its low pedestrian fatality rate, its high number of gyms per 10,000 residents and its low housing costs as a percentage of income. Omaha ranked seventh-best overall for its low pedestrian fatality rate of about 1 per 100,000 residents, sixth overall for its approximately 1.8 gyms per 10,000 residents and sixth overall for average housing cost as a percentage of income, at approximately 20.4%.
3. Arlington, VA
Arlington, Virginia has the second-highest number of gyms per 10,000 residents of any of the 95 cities in our study, at approximately 2.4. The city also ranks seventh overall for housing costs as a percentage of income, at slightly more than 20%. Arlington has a walk score of 68.9, the 15th-best score for this metric of any of the cities we analyzed.
4. San Francisco, CA
San Francisco, California had the third-highest walk score in this study, at 86. It also ranks within the top 10 of the study for the following metrics: number of gyms per 10,000 residents (approximately 1.8), number of races in 2019 (59) and percentage of the city that is parkland (approximately 19.6%).
5. New York, NY
New York City ranks first overall in terms of walk score, at 89.2. It also has the highest number gyms per 10,000 residents, at approximately 3.6. The city hosted the sixth-highest number races in 2019, a total of 67. New York is expensive, though, and ranks low in the study with regard to average housing costs as a percentage of income, roughly 28%, at 86th out of 95.
6. Seattle, WA
Seattle, Washington has the ninth-highest walk score in this study, 73.1. It also ranks ninth-highest for the number of races held in 2019, a total of 58. The Emerald City also ranks in the top 15 of the study for number of gyms per 10,000 residents, at 1.70.
7. St. Paul, MN
The other twin city, St. Paul, Minnesota, ties for the lowest pedestrian fatality rate in the study, at 0.68 per 100,000 residents. The city also consists of approximately 15.3% parkland, the 19th-highest percentage for this metric overall. In terms of number of gyms, St. Paul has 1.27 per 10,000 residents, ranking 36th overall for this metric
8. Cincinnati, OH
Cincinnati, Ohio had the 12th-highest number of races in 2019 of all the cities in our study, a total of 53. The city also ranked in the top 20 for both its low pedestrian fatality rate, at 1.22 per 100,000 residents, and its high number of gyms per 10,000 residents, at 1.49.
9. Madison, WI
Madison, Wisconsin ranks fourth for the metric of pedestrian fatality rate, at just 0.97 per 100,000 residents. It also has the fifth-highest number of gyms across all 95 cities in the study, at 2.05 per 10,000 residents. Additionally, Madison ranks 25th overall for the percentage of the city that is parkland, at almost 14%.
10. Pittsburgh, PA
Pittsburgh, Pennsylvania ranks within the top 25 of the study for four metrics. It has the 12th-lowest pedestrian fatality rate, at 1.15 per 100,000 residents and the 14th-highest number of gyms per 10,000 residents, at 1.65. Furthermore, Pittsburgh has the 23rd-best walk score across all 95 cities in the study, at 61.9, and it has the 24th-highest number of races, at a total of 38.
Data and Methodology
To find the best cities for runners, we analyzed data for 95 of the largest cities across the following six metrics:
- Walk score. This is a measure of a city’s overall walkability. Data comes from walkscore.com.
- Pedestrian fatality rate. This is the number of pedestrians killed in automobile accidents per 100,000 residents. Data comes from the National Highway Traffic Safety Administration, is for 2017 and is measured at the state level.
- Gyms per 10,000 residents. This is the number of gyms per 10,000 residents. Data comes from the Census Bureau’s 2017 County Business Patterns survey.
- Races held in 2019. Races include all 5ks, 10ks, half-marathons, marathons and ultra-marathons that take place in the city. Data comes from runningintheusa.com.
- Percentage of city that is parkland. This is the total adjusted city area divided by total parkland measured in acres. Data comes from the Trust for Public Land’s 2019 report.
- Housing costs as a percentage of income. This is the amount of annual median housing costs divided by median household income. It was included in this study as a measure of affordability. Data comes from the Census Bureau’s 2018 1-year American Community Survey.
First, we ranked each city in each metric, giving every metric equal weight. Then we found each city’s average ranking. Using this average ranking, we created our final score. The city with the highest average ranking received a 100. The city with the lowest average ranking received a 0.
Tips for Managing Your Money
- Run, don’t walk, to find a financial advisor. Running out of luck with managing your finances? A financial advisor can help make the most of your money. Finding the right financial advisor that fits your needs doesn’t have to be hard, though. SmartAsset’s free tool matches you with financial advisors in your area in five minutes. If you’re ready to be matched with local advisors that will help you achieve your financial goals, get started now.
- Are you ready to buy? Choosing where to live will impact your access to running options. As you go from the starting line to the dotted line while considering a new home, it’s important to choose first whether to rent or buy.
- How much house can you afford? If you’re certain that you’re ready to buy a house, it’s important to remember that not every house will be in the ideal price range for you. The decision is a marathon, not a sprint. Carefully find out how much house you can afford with SmartAsset’s free calculator.
Questions about our study? Contact press@smartasset.com
Photo credit: ©iStock.com/RainStar