 Written by
Asian American households saw the greatest increase in income over the past decade out of any other racial group in the U.S. From 2010 to 2019, the median household income across all households grew by 31.3%, from $50,046 to $65,712. Meanwhile, the median Asian American household income increased by almost 40%, from roughly $67,000 to more than $93,700.
Though incomes have risen for many Asian Americans, income inequality in the U.S. has also actually increased the most among Asians compared to all other groups, according to a 2018 report from Pew Research Center. This indicates that in some parts of the country, Asian Americans fare better when it comes to income, poverty rate and other personal finance factors.
Given both of these trends and in recognition of Asian American and Pacific Islander Heritage Month, we took a closer look at where Asian Americans fare best economically in the U.S. We compared 120 cities across five metrics: median Asian American household income, Asian American homeownership rate, poverty rate for Asian Americans, percentage of Asian American adults with a bachelor’s degree and percentage of business owners who are Asian American. For details on our data sources and how we put all the information together to create our final rankings, check out the Data and Methodology section below.
This study is part of a series. Our study on where Black Americans fare best economically in honor of Black History Month can be found here.
Key Findings
- California cities rank well. Four of the top 10 cities where Asian Americans fare best economically are in California. They include Fremont, Sunnyvale, Corona and Fontana. Census Bureau data shows that in 2019 the Asian American poverty rate was 5% or less in all four cities. Additionally, while Asian Americans make up only about 10% of business owners nationally, the percentage of business owners who are Asian American in each of these California cities is greater than 18%.
- Asian American incomes vary widely across cities. Though the median Asian American household income has risen significantly, it remains low in several large cities. In fact, the median Asian American household income is less than $50,000 in 13 of the 120 cities in our study, suggesting that Asian Americans are falling behind in some places. The two cities with the lowest median Asian American household incomes are both located in Upstate New York. In Buffalo, the median Asian American household income ($22,929) is about 44% lower than the overall city median household income ($40,843). Meanwhile, the Syracuse median Asian American household income ($31,408) is about 20% lower than the city’s median household income ($39,494).
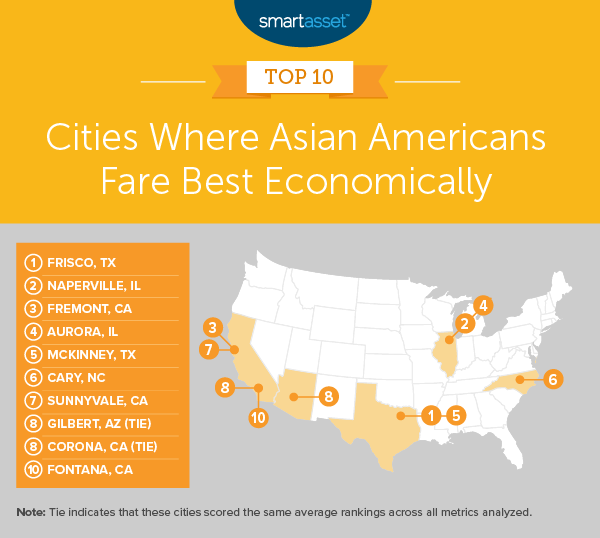
1. Frisco, TX
Frisco, Texas ranks in the top 10 cities for four of the five metrics in our study. It has the third-highest median Asian American household income ($155,335), seventh-highest Asian American homeownership rate (81.79%) and second-highest percentage of Asian Americans adults with a bachelor’s degree (84.4%). Additionally, in 2019, the Asian American poverty rate stood at 2.1%, fourth-lowest in our study.
2. Naperville, IL
The majority of Asian American adults in Naperville, Illinois (80%) have a bachelor’s degree. Census Bureau data from 2019 also shows that the median Asian American household income is almost $151,900 and that less than 1% of Asian Americans in Naperville fall below the federal poverty line. Compared to the other cities in the study, this is the fifth-highest median Asian American household income and the lowest Asian American poverty rate.
3. Fremont, CA
The median Asian American household income in Fremont, California is the highest in our study, at $172,095. Fremont also ranks in the top five cities for its relatively low 2019 Asian American poverty rate (2.6%) and relatively high percentage of business owners who are Asian American (22.25%). Fremont falls the furthest behind for its Asian American homeownership rate, which is roughly in line with the national average (60.59%). Census Bureau data shows that only about 63% of Asian American households in Fremont own their home or apartment.
4. Aurora, IL
Located roughly 10 miles west of Naperville, Aurora, Illinois ranks as the No. 4 city where Asian Americans fare best economically. The median Asian American household income in Aurora is about $116,800, which is the 10th-highest in our study. Additionally, Aurora has the fifth-highest Asian American homeownership rate (82.09%), the 22nd-lowest Asian American poverty rate (6.0%) and 24th-highest percentage of Asian Americans with a bachelor’s degree (70.2%).
5. McKinney, TX
The Asian American homeownership rate in McKinney, Texas is the second-highest in our study, at 88.52%. The median Asian American household income is just shy of $100,000 and more than seven in 10 Asian American adults have a bachelor’s degree. Additionally, the 2019 Asian American poverty rate stood at 6.9% and about 14% of business owners in the surrounding metro area are Asian.
6. Cary, NC
Cary, North Carolina ranks in the top 10 cities for three of the five metrics in our study. It has the seventh-highest median Asian American household income ($135,371), the 10th-lowest poverty rate for Asian Americans (3.9%) and the fourth-highest percentage of Asian Americans with a bachelor’s degree (83.1%). Though only about one in 20 business owners in the metro area surrounding Cary is Asian, the city ranks 26th out of 120 for its Asian American homeownership rate of about 69%.
7. Sunnyvale, CA
Sunnyvale, California has the highest percentage of business owners who are Asian American of any city in our study. Data from the Census Bureau’s 2018 Annual Business Survey shows that in the greater San Jose-Sunnyvale-Santa Clara metro area, 26.29% of business owners with paid employees are Asian Americans. Sunnyvale also has the second-highest median Asian American household income ($166,576) and 12th-highest percentage of Asian Americans with a bachelor’s degree (76.4%).
8. Gilbert, AZ (tie)
The median Asian American household income in Gilbert, Arizona is 12th-highest in our study, at $115,422. Gilbert also ranks well for its relatively low Asian American poverty rate (5.7%). While less than 6% of the business owners in the surrounding metro area are Asian American, more than 69% of Asian American adults in the city have a bachelor’s degree.
8. Corona, CA (tie)
Southeast of downtown Los Angeles, the California city of Corona ties with Gilbert, Arizona as the No. 8 city where Asian Americans fare best economically. Corona ranks in the top 15 cities for three metrics: median Asian American household income ($125,810), a relatively low Asian American poverty rate (5.0%) and percentage of business owners who are Asian American (18.56%). About half of Asian American adults in the city have their bachelor’s degree.
10. Fontana, CA
Fontana, California rounds out our list of the top 10 cities where Asian Americans fare best economically. Though the median Asian American household income ($76,139) is much lower than other cities in our top 10, Fontana has the eighth-highest Asian American homeownership rate (about 82%) and ninth-lowest Asian American poverty rate (3.6%).

Data and Methodology
To find the cities where Asian Americans fare best economically, SmartAsset looked at the 200 largest cities in the U.S. Of those, 120 of cities had complete data available. We compared those cities across five metrics:
- Median Asian American household income. Data comes from the Census Bureau’s 2019 1-year American Community Survey.
- Asian American homeownership rate. This is the number of Asian American owner-occupied housing units divided by the number of Asian American occupied housing units. Data comes from the Census Bureau’s 2019 1-year American Community Survey.
- Poverty rate for Asian Americans. Data comes from the Census Bureau’s 2019 1-year American Community Survey.
- Percentage of Asian American adults with a bachelor’s degree. This is for the Asian American population 25 years and older. Data comes from the Census Bureau’s 2019 1-year American Community Survey.
- Percentage of business owners who are Asian American. This is the number of Asian American-owned business with paid employees divided by the number of businesses with paid employees. Data comes from the Census Bureau’s 2018 Annual Business Survey and is at the metro area level.
To determine our final list, we ranked each city in every metric, giving a full weighting to all metrics. We then found each city’s average ranking and used the average to determine a final score. The city with the highest average ranking received a score of 100. The city with the lowest average ranking received a score of 0.
Editors’ Note: SmartAsset published this study in celebration and recognition of Asian American and Pacific Islander Heritage Month. The spate of ongoing violence against Asian Americans, protests for racial justice and the outsized impact of COVID-19 on people of color have highlighted the social and economic injustice that many Americans continue to face. We are aiming to raise awareness surrounding economic inequities and provide personal finance resources and information to all individuals.
Tips For Improving Your Financial Wellness
- Invest as early as you are able. To have an early retirement, it is important to take advantage of compound interest by investing early. Take a look at our retirement calculator to see how your investment in a savings account can grow over time.
- Mortgage management. It is important when purchasing a home to know what you’ll pay each month and for how long. To get a sense of what that might look like, check out SmartAsset’s free mortgage calculator.
- Consider professional financial help. A financial advisor can help you make smarter financial decisions to be in better control of your money. SmartAsset’s free tool matches you with financial advisors in five minutes. If you’re ready to be matched with advisors that will help you achieve your financial goals, get started now.
Questions about our study? Contact press@smartasset.com.
Photo credit: © iStock/JGalione