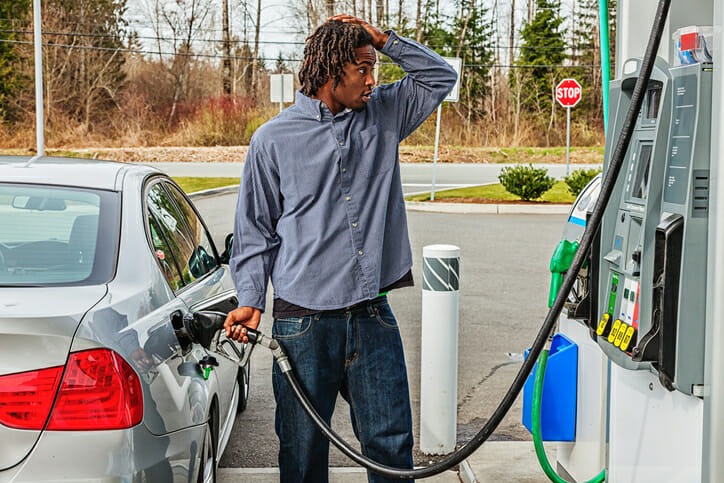
After months of climbing gas prices, the national average has hit new highs, reaching $5 per gallon of regular gasoline in June. According to recent data from AAA, the national average for regular gasoline was $4.98 per gallon on June 20, 2022. With these significant increases, Americans across the country are looking for new ways to adjust their budgets and stretch paychecks.
Residents in some states have been affected more than others, however. Beyond differences in how much the price of gas has gone up in each state, elevated gas price figures translate differently. In places with lower incomes, higher gas prices may be more difficult to afford. In this study, SmartAsset analyzed the states where gas prices are highest and lowest relative to incomes, using data from AAA and the Census Bureau.
This is SmartAsset’s second look at how high gas prices are affecting residents in different states. Read our other study here.
Data and Methodology
To find where gas prices are highest and lowest relative to incomes, we analyzed data for all 50 states and the District of Columbia. We assumed that drivers purchase an average of 562 gallons of gas per year, or drive 13,500 miles per year in a Ford F-150 (the most popular car in the U.S.), which gets about 24 miles per gallon.
From there, we calculated annual gas spending using regular gas prices from AAA for June 20, 2022. We then divided that figure by the median household income adjusted to 2022 dollars, using data from the Census Bureau’s 2020 American Community Survey 1-year Experimental Survey and the Consumer Price Index for Urban Wage Earners and Clerical Workers (CPI-W) from the Bureau of Labor Statistics.
This left us with estimated annual gas spending for one car as a percentage of the median household income. States were ranked from highest to lowest according to that figure.
Key Findings
- From mid-February to mid-June 2022, the average price per gallon has increased by 42%. Across all 50 states and the District of Columbia, the average price per gallon of regular gasoline stood at $3.51 in mid-February, according to data from AAA. The recent figure stands at $4.96. Across all places, the average price per gallon is highest in California ($6.40) and lowest in Georgia ($4.47).
- Average annual gas spending for one car in West Virginia makes up more than 5% of the median household income. West Virginia ranks worst in our study. The average price of a gallon of gas as of mid-June 2022 is $4.92 and median household income adjusted for inflation is roughly $54,700.
- Residents in Mid-Atlantic states are least impacted by recent hikes. Three of the five places where gas prices are lowest relative to incomes are in the mid-Atlantic. They include the District of Columbia, Maryland and New Jersey. Delaware also ranks in the top 15 states, with average annual gas spending for one car making up 3.54% of the median household income.
Where Gas Prices Are Highest Relative to Incomes
Six of the 10 states where gas prices are highest relative to incomes are in the South. West Virginia and Mississippi rank first and second with average annual gas spending for one car making up 5.05% and 4.82% of the median household incomes in each state, respectively. The remaining four Southern states include Arkansas, Louisiana, Kentucky and Alabama.
Across the 10 states where gas is most unaffordable, Nevada has the highest median household income, at about $71,500. However, gas prices are also high in the Silver State. Data from AAA shows that regular gasoline averaged $5.64 per gallon on June 20, 2022, the second-highest in our study, falling behind only the state of California.
Where Gas Prices Are Lowest Relative to Incomes
The District of Columbia ranks best in our study. We estimate that average gas spending for one car in the nation’s capital makes up only 2.70% of the median household income. Though the average price per gallon of regular gas is higher than the national average - at $5.14 - the median household income adjusted for inflation is higher than all 50 states - at $107,205.
In three other states, average gas spending for one car makes up less than 3% of the median household income. They include Maryland, Massachusetts and New Jersey. Across those three states, the average price for regular gasoline is around $5, mirroring the national average. However, similar to the District of Columbia, median household incomes are high compared to the rest of the country. The adjusted median household income exceeds $96,000 in all three states.
Financial Tips for Car Owners
- Use an app to help you find cheaper gas. Many experts recommend downloading the GasBuddy app, a program that tracks gas prices in your area. GasBuddy, which has been downloaded nearly 100 million times, has real-time price information for 150,000 gas stations nationwide.
- Have a pro examine your finances. The recent spike in gas prices may be a reason to reevaluate your spending habits. A financial advisor can help you assess your budget and find ways to scale back your spending. Finding a qualified financial advisor doesn’t have to be hard. SmartAsset’s free tool matches you with up to three financial advisors who serve your area, and you can interview your advisor matches at no cost to decide which one is right for you. If you’re ready to find an advisor who can help you achieve your financial goals, get started now.
Questions about our study? Contact us at press@smartasset.com
Photo credit: ©iStock.com/jhorrocks
