 Written by
Whether you were once cut off by a car with Florida license plates or mercilessly tailgated by a driver in New York, we’ve all had bad experiences with drivers from other states (or our own) at some point. Besides the road rage, these situations can give us a lot of grief when it comes to managing expenses, but it often varies by location. Which states truly have the worst drivers?
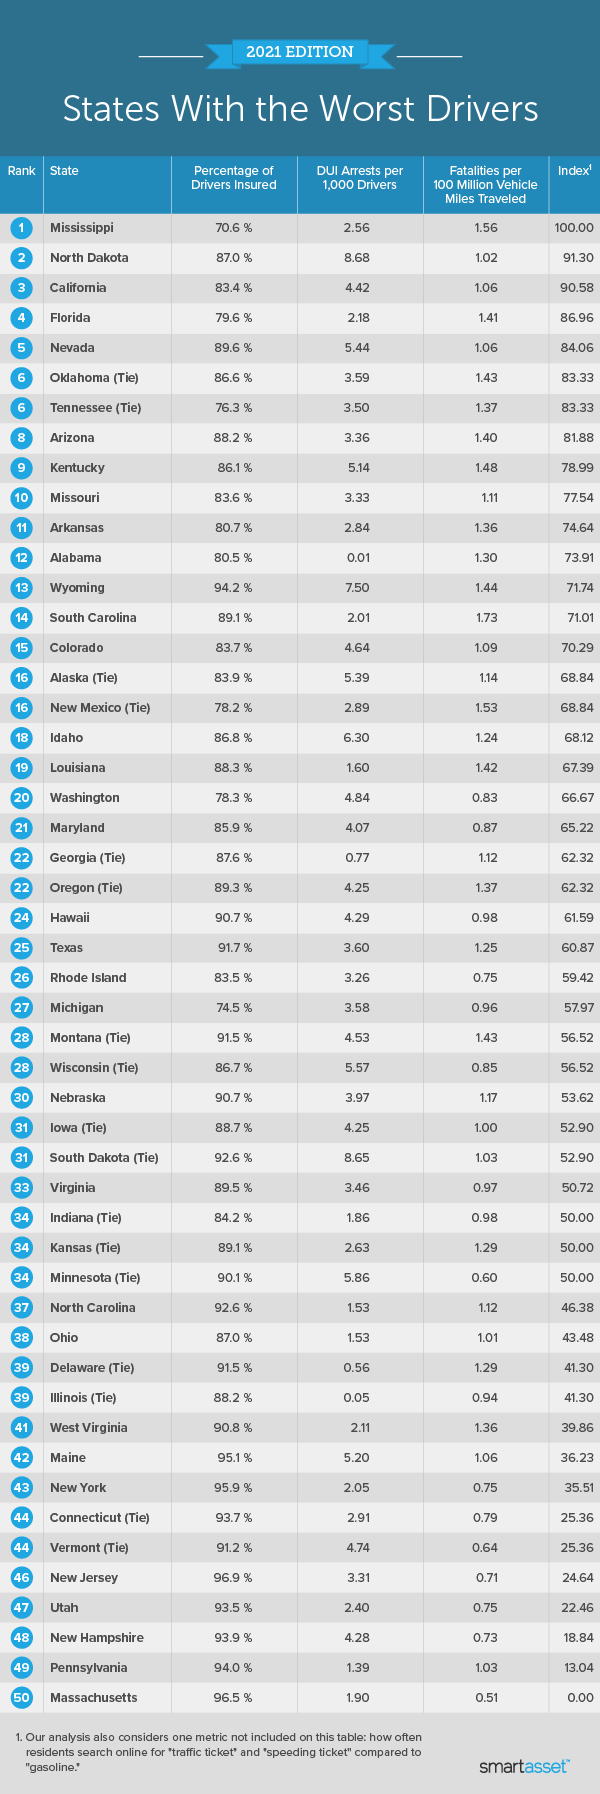
To find out which states have the worst drivers, we dug deep into relevant data and considered four metrics: percentage of drivers who are insured, number of driving under the influence (DUI) arrests per 1,000 drivers, number of fatalities per 100 million vehicle miles driven and how often residents Google terms like “traffic ticket” or “speeding ticket.” For details on our data sources and how we put all the information together to create our final rankings, check out the Data and Methodology section below.
This is SmartAsset’s fifth annual study on the states with the worst drivers. See the 2020 version here.
Key Findings
- Mississippi ranks worst, again. Mississippi may be known for its Southern hospitality, but it has the worst drivers in the country for the fourth year in a row, according to our metrics. It has the second-highest fatality rate and the absolute lowest percentage of insured drivers.
- Northeastern states have the best drivers. Drivers in Northeastern states like Massachusetts, New York and New Jersey may get bad raps, but the statistics tell a different story. Eight of the 10 states with the best drivers according to our metrics are in the Northeast – including Massachusetts, whose drivers are rated as the very best for the fifth consecutive year.
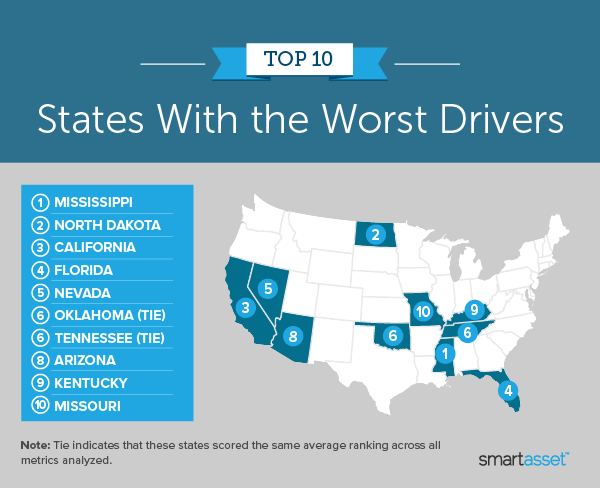
1. Mississippi
Mississippi has the lowest percentage of insured drivers (70.6%) of all 50 states, as well as the second-highest fatality rate per 100 million vehicle miles driven at 1.56. The Magnolia State also has the fifth-highest ratio of Google searches for “speeding ticket” or “traffic ticket” relative to searches for “gasoline” (3.28).
2. North Dakota
North Dakota, which ranked 20th on last year’s list, jumps up to the No. 2 spot this time around. No state has more DUI arrests per 1,000 drivers than North Dakota (8.68). The state also ranked third for its relatively high number of Google searches for “speeding ticket” or “traffic ticket” relative to searches for gasoline.
3. California
While California has more drivers than any other state in the country, only 83.4% of them are insured – the ninth-lowest percentage for this metric. The Golden State, meanwhile, also has the 15th-highest number of DUI arrests per 1,000 drivers (4.42) and sixth-highest rate of Google searches for “speeding ticket” or “traffic ticket” relative to gasoline-related searches (3.25).
4. Florida
Florida, whose drivers also ranked fourth-worst in last year’s study, has the sixth-lowest percentage of insured drivers, 79.6%, this time around. The Sunshine State has the ninth-highest number of fatalities per 100 million vehicle miles driven (1.41) and the ninth-highest ratio of Google searches for “speeding ticket” or “traffic ticket” to Google searches for “gasoline” (2.88).
5. Nevada
With the highest rate for the Google search metric, Nevada takes the No. 5 spot for worst drivers, according to our study. Home to Las Vegas and the Hoover Dam, Nevada also has the seventh-most DUI arrests per 1,000 drivers and is tied for having the 26th-highest fatality rate per 100 million vehicle miles driven.
6. Oklahoma (tie)
The Sooner State is another newcomer to this year’s top 10. Oklahoma has the sixth-highest fatality rate per 100 million vehicle miles driven, at 1.43. The state also has the 17th-lowest percentage of insured drivers, as roughly 87% of drivers there are insured.
6. Tennessee (tie)
Tennessee, which was rated as the No. 3 state for the worst drivers in America last year, is tied for No. 6 this year. The Volunteer State has the third-lowest percentage of insured drivers (76.3%) and the 11th-highest rate of fatalities per 100 million vehicle miles driven (1.37). When it comes to DUI arrests, Tennessee is middle of the road, at 25th overall.
8. Arizona
Arizona has the 10th-highest number of fatalities per 100 million vehicle miles driven, at 1.40. Meanwhile, the Grand Canyon isn’t all that Arizona residents are searching for on Google. The state has the eighth-highest rate in the study of “traffic ticket” and “speeding ticket” Google searches relative to gasoline-related searches.
9. Kentucky
Kentucky earned a spot in the top 10 by having the fourth-highest number of traffic fatalities (1.48) per 100 million vehicle miles driven and the 10th-highest DUI arrests per 1,000 drivers. This state also has the 16th-lowest figure among all 50 states for the number of drivers with auto insurance – 86.1%.
10. Missouri
The Show Me State has the 11th-lowest insurance rate (83.6%) and 11th-highest rate for the Google search metric we considered. Missouri drivers were ranked the country’s 18th-worst last year.
Data and Methodology
To find the states with the worst drivers, we looked at data on all 50 states across these four metrics:
- Fatalities per 100 million vehicle miles driven. Data comes from the National Highway Traffic Safety Administration and is from 2019.
- Arrests for driving under the influence per 1,000 drivers. Data on DUI arrests comes from the FBI. Data on the number of drivers comes from the Department of Transportation. Data is from 2019.
- Percentage of drivers who are insured. Most recently available data comes from the Insurance Research Council, as reported by Forbes, and is from 2019.
- Google Trends on driving tickets. This is how often residents in each state Google “speeding ticket” and “traffic ticket.” To control for the number of drivers in each state, we compared “speeding ticket” and “traffic ticket” Google Trends data to “gasoline” Google Trends data. We pulled data for the period between May 2020 and May 2021.
First, we ranked each state in each of the four metrics. We then computed each state’s average ranking, giving each metric equal weighting. We used the average rankings to create our final scores. The state with the highest average ranking received a score of 100, while the state with the lowest average ranking received a score of 0.
Tips for Managing the Roadmap to Financial Success
- Hire an expert to help you navigate. A financial advisor can help you craft a budget, plan for the unexpected and build confidence about your financial future. Don’t have a financial advisor yet? SmartAsset’s free matching tool can pair you up with as many as three professionals in as little as five minutes. If you’re ready to connect with advisors, get started now.
- Build an emergency fund for those unexpected detours. Do you have enough money saved to cover an emergency or pay for an unforeseen life event? Personal finance experts typically recommend having between three and six months’ worth of expenses saved in the event you lose your job or need to pay for an emergency expenditure. Use our savings calculator to find out how long it will take to build your own emergency fund.
Questions about our study? Contact press@smartasset.com.
Photo credit: ©iStock.com/Marcos Assis