 Written by
Some 67% of consumers in the U.S. carried at least one type of non-mortgage debt as of June 2020, according to Experian. As Americans contend with those financial burdens on top of housing costs, it behooves them to find housing options that are affordable relative to their salary. With this in mind, SmartAsset crunched the numbers to uncover where the average household can afford the most home given their particular financial circumstances.
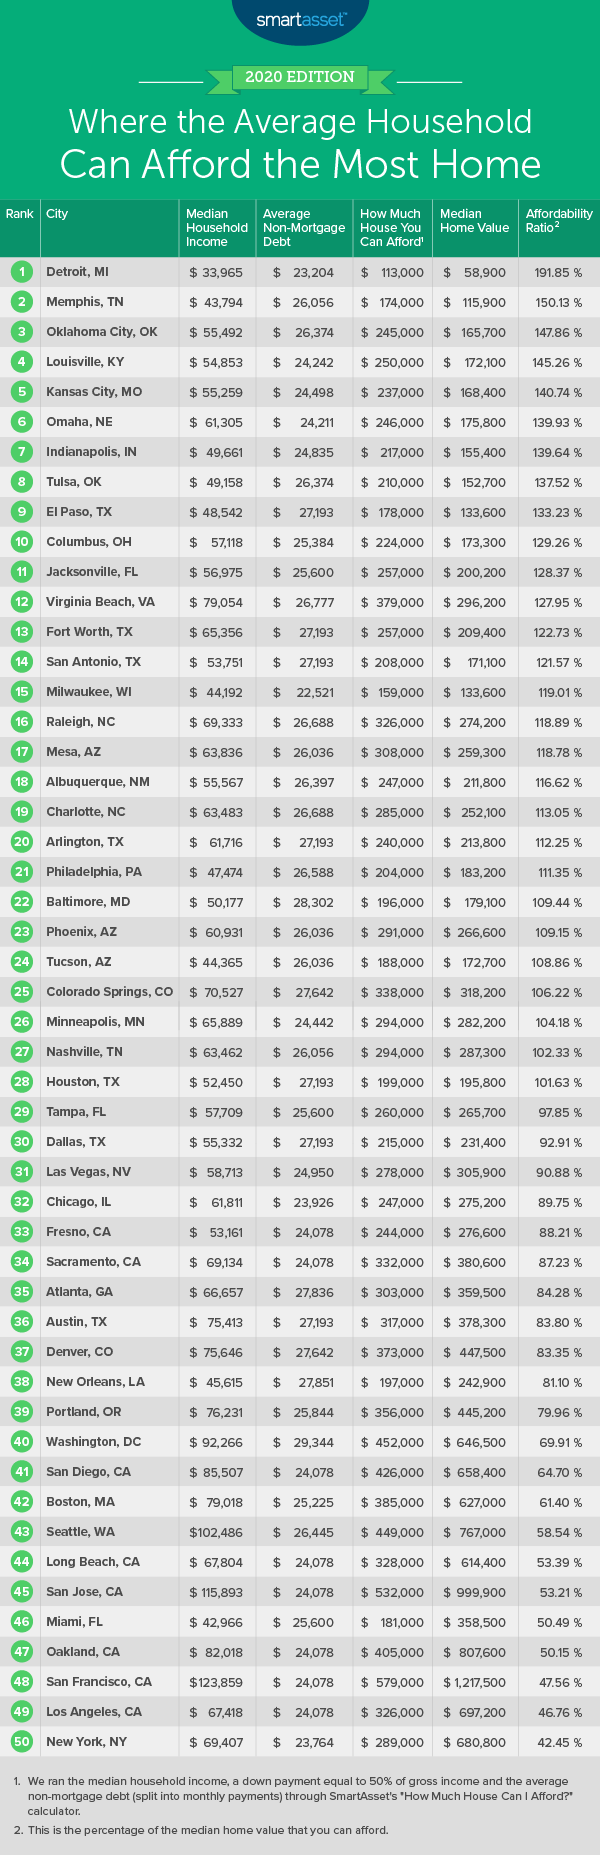
To find where the average household can afford the most and least home, we examined data on the 50 largest cities in the U.S. Specifically, we used our home buying calculator to input data on the median household income in each city and average non-mortgage debt to estimate how much home the average household could afford. We then ranked cities based on where local households could afford the most and least home relative to the median home value in the area. For details on our data sources and how we put all the information together to create our final rankings, check out the Data and Methodology section below.
This is SmartAsset’s second annual study on where the average household can afford the most and least home. Check out the 2019 version here.
Key Findings
- Detroit and Oklahoma City stay affordable; Oakland becomes less affordable. Compared to last year’s analysis, Detroit and Oklahoma City still rank within the top three cities where the average household can afford the most home, with affordability ratios increasing to roughly 192% and 150%, respectively. Meanwhile, of the five cities where the average household can afford the least home, all but one are the same as last year: Long Beach, California moved out of the bottom five, replaced by Oakland, which jumped from sixth-worst in our 2019 study to fourth-worst in this year’s analysis.
- Some big-city dwellers with debt may struggle to afford a home. In 22 of the 50 cities in our study, households cannot afford the city’s median-valued home while paying off the average non-mortgage debt. In fact, the typical household with debt can only afford less than 50% of the median home value in three cities: New York, Los Angeles and San Francisco.
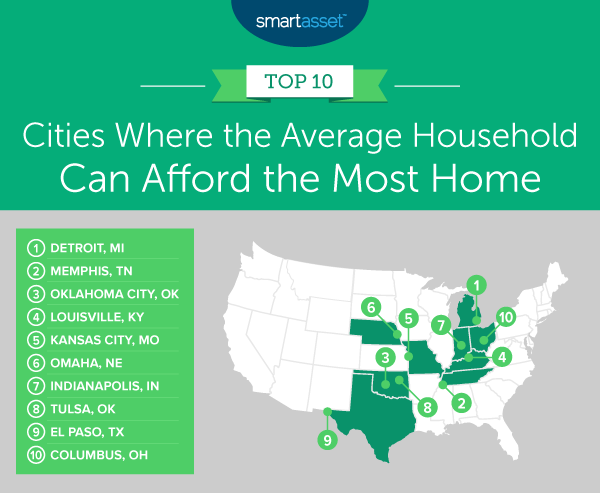
Cities Where Residents Can Afford the Most Home
1. Detroit, MI
Detroit, Michigan is the city in our study where the average household can afford the most home. The median household income in Detroit is almost $34,000. Assuming a household puts down 50% of its gross income on a home and has a monthly debt payment of about $260 (measured at the state-level), the average household could afford a home worth $113,000. This is almost double the median home value in the city ($58,900).
2. Memphis, TN
The median household income in Memphis, Tennessee is about $43,800. Assuming a monthly debt payment of $289 (a state-level metric) and a down payment of about $21,900, the average household in the city could afford a home worth $174,000. Relative to the median value home ($115,900), this is about 50% more.
3. Oklahoma City, OK
Oklahoma City, Oklahoma is the No. 3 city in our study, jumping down one spot compared to last year’s analysis. The average household in the city can afford a home of $245,000. This is almost 48% more than the median value home in Oklahoma City ($165,700).
4. Louisville, KY
The median home value in Louisville, Kentucky is $172,100. Given an average household income of about $54,900 in Louisville and a monthly debt payment of about $270 state-wide, we estimate that the average household in the city can afford a home that is valued at about 45% more than the median home value of $250,000.
5. Kansas City, MO
The average household in Kansas City, Missouri has an income of $55,259. Assuming a down payment of $27,630 (10% of income saved over five years) and a state-wide average monthly debt payment of $272, a typical Kansas City household would be able to afford a home that is almost 41% more than the median home value in the city ($168,400).
Cities Where Residents Can Afford the Least Home
1. New York, NY
New York, New York is the U.S. city where residents can afford the least home. The median household income is $69,407 and the state-wide monthly debt payment is $264 on average. If the average New York City household saved $34,704 for a down payment (10% of income annually for five years), it would only be able to afford less than 43% of the median home value in the city ($680,800).
2. Los Angeles, CA
The average household in Los Angeles, California would only be able to afford 46.76% of the median valued home, a total of $326,000 compared to the median home value in the city of $697,200. This is assuming a median household income of $67,418, $267 in monthly debt payments (a state-wide metric) and roughly $33,700 saved up for a down payment.
3. San Francisco, CA
Although the median household income in San Francisco, California is the highest in our study ($123,859), so is the median home value ($1,217,500). Given average monthly debt payments of $267 in California and assuming $61,930 saved up in San Francisco over five years for a down payment, the average household in San Francisco could afford a home valued at $579,000.
4. Oakland, CA
In Oakland, California, the average household can afford only 50.15% of the median home value. With an average household income of $82,018, average monthly debt payments of $267 (state-wide in California) and down payment of $41,009 (10% of income saved up each year over five years in the city), this household could afford a home at $405,000, compared to the median home value of $807,600.
5. Miami, FL
The median home value in Miami, Florida is $358,500. The average household in Miami can afford only $181,000, or 50.49% of that median home value. This is assuming a median household income of $42,966, a monthly debt payment of $284 in the state and $21,483 saved up for a down payment.
Data and Methodology
To find the cities where the average household can afford the most and least home, we examined data across the 50 largest U.S. cities across four metrics:
- Median household income. Data comes from the Census Bureau’s 2019 1-year American Community Survey.
- State average non-mortgage debt. Data comes from Experian and is for Q2 2020. To estimate monthly debt payments, we assumed debt would be paid off within 10 years at 6% interest.
- Median home value. Data comes from the Census Bureau’s 2019 1-year American Community Survey.
- Down payment. We assumed the average household would save 10% of its income for five years.
To create our rankings, we first estimated how much home the average resident could afford. To do this, we ran the above figures through SmartAsset’s How Much Home Can I Afford? calculator. We then compared how much home the average household could afford to the local median home value. The city with the highest affordability ratio ranked first on our list of where the average household could afford the most home. The city with the lowest affordability ratio ranked first on our list of where the average household could afford the least home.
Tips for Current or Potential Homeowners
- A strong financial foundation is key. Don’t be afraid to seek expert support. Finding the right financial advisor doesn’t have to be hard. SmartAsset’s free tool matches you with financial advisors in your area in five minutes. If you’re ready to be matched with local advisors who will help you achieve your financial goals, get started now.
- Mortgage management. It’s important to know when purchasing a home what you’ll be paying each month and for how long. To get a sense of what that might look like, check out SmartAsset’s free mortgage calculator.
- Calculate the full costs. Property taxes and home insurance can add up. To understand the full costs of homeownership more fully, check out our comprehensive home buying guide. It has a property tax calculator, budget calculator and many informative articles that can help you make smart decisions regarding housing.
Questions about our study? Contact press@smartasset.com.
Photo credit: ©iStock.com/RyanJLane