 Written by
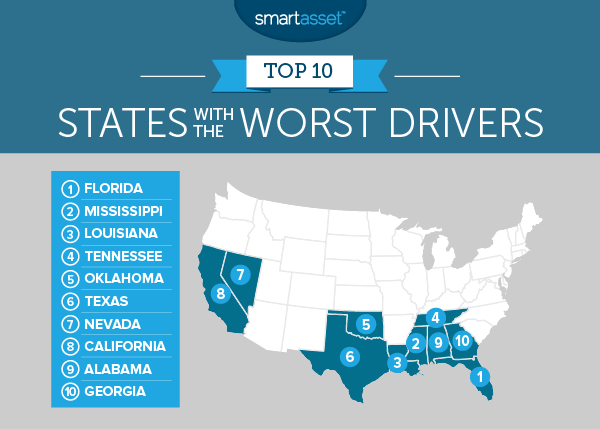
Most people think they’re good drivers. But the law of averages and statistics on motor vehicle deaths suggest this isn’t the case. Some states have gained a reputation for having particularly bad drivers. We looked into the data to determine which states deserve this reputation and which don’t. Below we rank the 10 states with the worst drivers in the country.
Looking to buy a new home? Check out mortgage rates in your area.
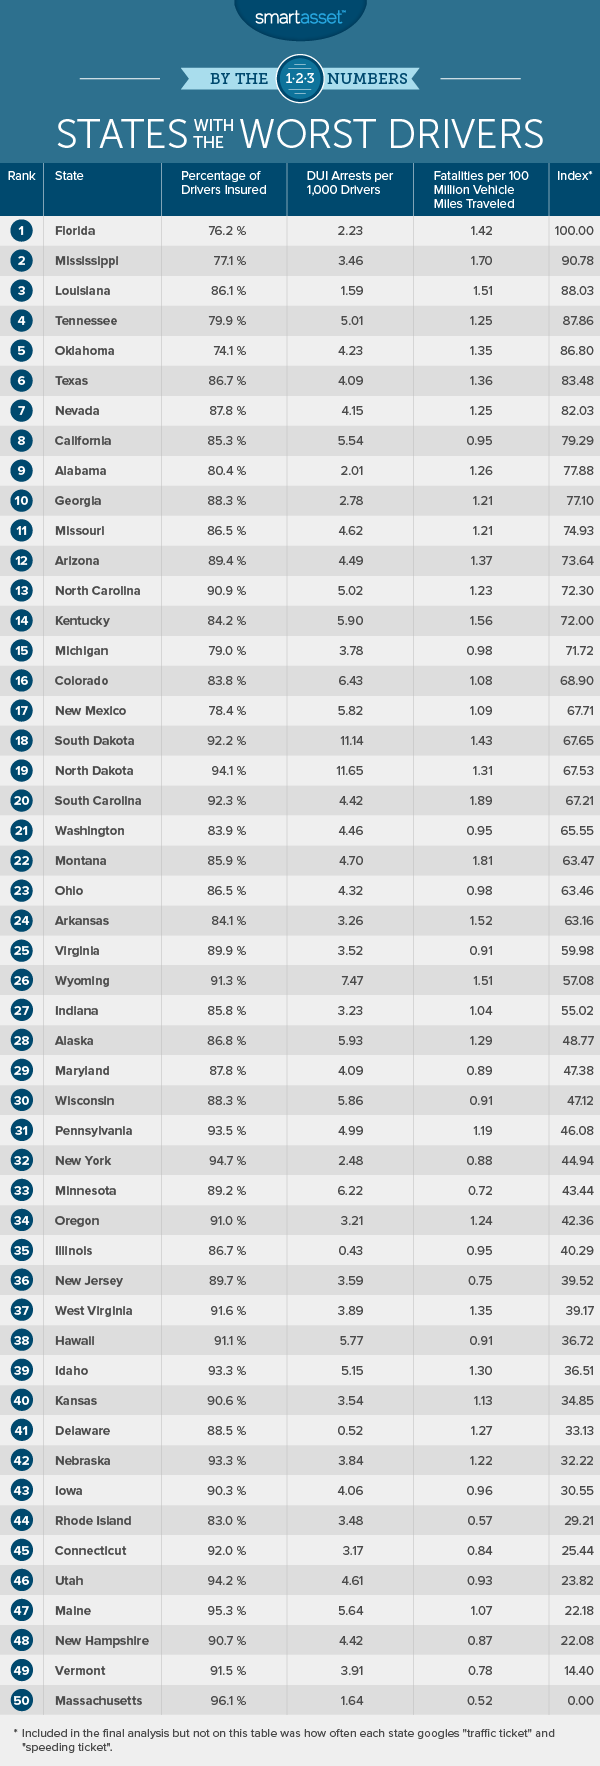
In order to find the states with the worst drivers, SmartAsset looked at factors like the percentage of drivers who have auto insurance, the DUI rate, the number of people killed per 100 million vehicle miles and how often people search the term “parking tickets” on Google. Check out our data and methodology below to see where we got our data and how we put it together.
This is SmartAsset’s second annual study on the states with the worst drivers. See the 2016 edition of the study here.
Key Findings
- Bad driving in the South – Eight of our top 10 states with the worst drivers are in the South. These states tend to have higher numbers of people killed per 100 million vehicle miles driven, as well as having lower rates of drivers who are insured.
- The best drivers are in New England – Four of the five states at the bottom of the list (i.e. the states with the best drivers) are New England states. These are Massachusetts, Vermont, New Hampshire and Maine.
- DUI and fatalities – According to our data, DUI arrests and fatalities per 100 million miles driven are not strongly correlated. This could simply mean that places with high numbers of DUI arrests are places where law enforcement are more aggressive in arresting offenders.
- Only a few changes – Many of the states who finished in the top 10 in last year’s study made repeat appearances this year. In particular, Florida and Mississippi secured top 5 spots in both editions of this study. However three states were newcomers to the top 10 this year. These states were Louisiana, California and Georgia.
1. Florida
For the second year in a row the Sunshine State topped our list of the states with the worst drivers. According to our data, in 2015 Florida had a fatalities rate per 100 million vehicle miles driven of 1.42, the ninth-highest in the nation. Florida drivers also seem prone to ignoring the rules of the road. Florida residents Googled “speeding ticket” or “traffic ticket” at the ninth-highest rate in the country. This may suggest they’re accumulating traffic tickets at higher rates than many other states.
However one factor working in Florida’s favor is the lack of DUI arrests. Florida had the 45th-lowest rates of DUIs arrests in our study.
2. Mississippi
Driving is probably the most dangerous activity the average person partakes in daily. According to data from the National Highway Traffic Safety Administration, just over 35,000 people died from fatal car accidents in 2015. The U.S. average for fatality rate per 100 million vehicle miles driven is 1.13.
Mississippi is second on our list for the second year in a row because the chances of dying in a fatal car accident is higher in Mississippi than most states. In 2015 about 1.70 people died for every 100 million vehicle miles driven. In total, 677 people died in vehicular accidents in Mississippi in 2015. It ranked third in the country this metric. The good news is that vehicular fatality rates are on their way down in the Magnolia State. In 1995, the fatality rate per 100 million vehicle miles traveled was 2.94.
3. Louisiana
Louisiana is a newcomer to our top 10. This year it took a spot thanks to below-average scores in every metric we tracked except for one: DUI arrest rate per 1,000 drivers. Louisiana has the third-lowest DUI arrest rate per 1,000 drivers in the country.
However it has particularly alarming numbers of vehicular-related fatalities in Louisiana. According to our data, Louisiana has the sixth-highest number of fatalities per 100 million vehicle miles driven at 1.51. Residents here also Google “speeding tickets” and “parking tickets” more often than residents in any other state.
4. Tennessee
Tennessee scores in the top 20 for all our bad-driving indicators. This state’s worst score comes in the percent of drivers who are insured, with only 80% of drivers having auto insurance. This means there is roughly a 20% chance that when another driver rear-ends you in Tennessee, they won’t have insurance to pay for it. This is the fourth-lowest rate in the top 10.
On top of that Tennessee has a fairly high rate of DUIs. According to our data, there are about 2.2 DUI arrests for every 1,000 drivers in the state. In that statistic, Tennessee ranks 15th in the country.
5. Oklahoma
Oklahoma fell two spots this year to fifth place for states with the worst drivers. The Sooner State has the lowest rate of drivers with auto insurance in the country. Only 74% of drivers in Oklahoma are insured. This means that when there’s a car accident, odds are higher someone will be paying out of pocket. And car-related charges can be expensive.
Oklahoma is another one of those states with a high rate of fatal vehicular accidents but with a low number of DUI arrests. Oklahoma has the 12th-highest fatality rate per 100 million vehicle miles driven and only the 25th-highest DUI arrest rate per 1,000 drivers.
6. Texas
Texas is a relatively dangerous place to be on the road. This state has a fatality rate of 1.36 per 100 million vehicle miles driven, the 11th-highest rate in the country. Overall 3,516 people were killed in vehicle accidents in Texas in 2015 and 44% were killed in accidents involving alcohol.
Perhaps this sheds some light on Texas residents’ Google habits. According to Google Trends data, there are only six states in which residents search for “speeding tickets” or “traffic tickets” more often than Lone Star State residents do.
7. Nevada
Last year, the Silver State took the final spot in our list of the states with the worst drivers. This year it ranked worse. According to Google Trends, Nevada residents search “traffic tickets” more than the other states in the top 10 save for Louisiana and Georgia.
Nevada drivers also score in the wrong half for fatality rate. According to our data about 1.25 people die for every 100 million vehicles miles driven, the 12th-highest rate in the country.
8. California
The only good news for California drivers, according to our data, is that they are the least likely to be killed in a vehicular-related accident of any state in our top 10. Other metrics, however, suggest California drivers have picked up some bad habits behind the wheel.
For example, this state has about 5.5 DUI arrests for every 1,000 drivers. Also, only 85% of drivers have car insurance, meaning if there is an accident somebody may be left in the lurch.
9. Alabama
Alabama drivers will be happy to learn that the state improved its overall ranking by three spots from last year. The Yellowhammer State scores poorly on all metrics except for arrest rate for DUIs. This state has the 18th-highest fatality rate per 100 million vehicle miles driven and the 12th-highest rate of using Google to search speeding and traffic tickets.
Also, you are more likely to come across a driver without auto insurance here than you are in 43 other states. Roughly 20% of Alabama drivers are uninsured.
10. Georgia
The Peach State is the final state in our top 10 and is the last newcomer to the list. Data from National Highway Traffic Safety Administration shows that Georgia has the 14th-highest pedestrian fatality rate per 100,000 residents in the country. The non-pedestrian numbers could use improvement, too: Georgia had the 24th-highest fatality rate per 100 million vehicle miles driven.
Data from Google Trends suggest Georgia drivers are prone to breaking the rules of the road. Georgia residents Google “speeding tickets” or “traffic tickets” at the second-highest rate in the country.
Data and Methodology
In order to find the states with the worst drivers, we looked at data on all 50 states. Specifically, we looked at data on the following four factors:
- Fatalities per 100 million vehicle miles driven. Data comes from the National Highway Traffic Safety Administration and is from 2015.
- Arrests for driving under the influence per 1,000 drivers. Data on DUI arrests comes from the FBI and data on number of drivers comes from the Department of Transportation. Data is from 2015
- Percent of drivers who are insured. Data comes from the Insurance Research Council and is from 2016.
- Google Trends on driving tickets. This is the average of how each state ranked in Google Trends from July 2016 to July 2017 for four search terms: “speeding ticket,” speeding ticket, “traffic ticket” and traffic ticket. To control for the number of drivers in the state, we compared these figures to the Google Trends data for the term “gasoline.”
After ranking each state in each metric, we found each state’s average ranking, giving each metric equal weighting. We assigned each state a score based on its average ranking. The state with the best average ranking received a score of 100. The state with the worst average ranking received a 0.
How to Get Affordable Car Insurance
Much like how banks and other financial institutions give preferential rates to people with responsible financial histories, car insurance companies give the best rates to people with a history of good driving. Here are some tips you can use to lower your car insurance rates.
If you’ve been a poor driver in the past but have shown improvement over time, you may be able to reach out to your auto insurer and ask for a better rate. Credit scores can be important, as well. If you have recently raised your credit score, you may be able to negotiate lower rates.
Another option is to go for a package deal. If you currently use a company for your homeowners insurance or your life insurance, it’s possible they will give you a better rate for your car insurance as a reward for your loyalty.
The amount you drive is also a factor. If you can prove to the auto insurance company that you’re an infrequent driver, you may be less of a liability to them. This may make you eligible for lower rates.
Nick Wallace completed the data analysis for this study.
Questions about our study? Contact press@smartasset.com.
Photo credit: ©iStock.com/nd3000