 Written by
The COVID-19 pandemic has impacted the personal finances of millions of Americans, making it difficult for many to meet their financial needs and goals. While unemployment has declined by more than half from its high of 14.8% in April 2020, the rate of 6.2% in February 2021 is still almost twice as high as the pre-pandemic rate of 3.5% in February 2020.
Of course, economic hardships cannot be attributed solely to the coronavirus. Multiple factors — including the devastating blizzards that hit several states in February 2021 — have wreaked havoc on people’s financial livelihoods and impeded their ability to cover basic housing and food expenses. Still, though not operating in a vacuum, the pandemic has had an outsize influence on Americans’ struggles and infiltrated nearly every aspect of their financial lives. Now, more than one year after the coronavirus outbreak, SmartAsset took a closer look at the states where residents are financially hurting the most.
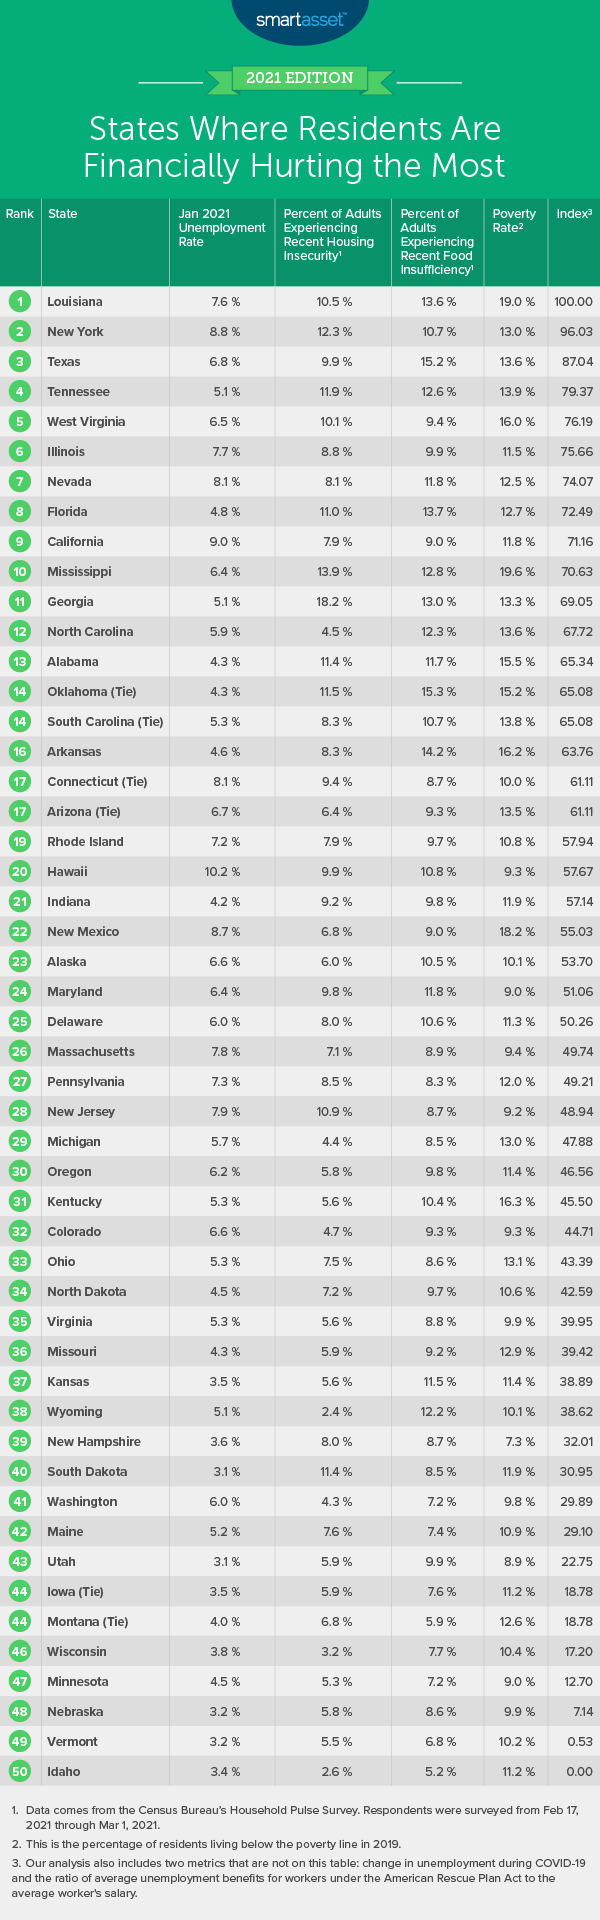
To do this, we examined data from all 50 states across the following six metrics: January 2021 unemployment rate, change in unemployment during COVID-19, unemployment replacement rate, recent housing insecurity, recent food scarcity and poverty rate. For details on our data sources and how we put all the information together to create our final rankings, check out the Data and Methodology section below.
This is SmartAsset’s second study on the states where residents are financially hurting the most. Read the 2020 version here.
Key Findings
- Residents in top-ranking states tend to face higher unemployment rates. From February 2020 to January 2021, the national unemployment rate rose by 2.8 percentage points, while the average increase for the 10 states hurting the most financially was 3.1 percentage points. That pushed the average unemployment rate across the top 10 states to 7.1%, almost a full percentage point higher than the 6.2% national unemployment rate.
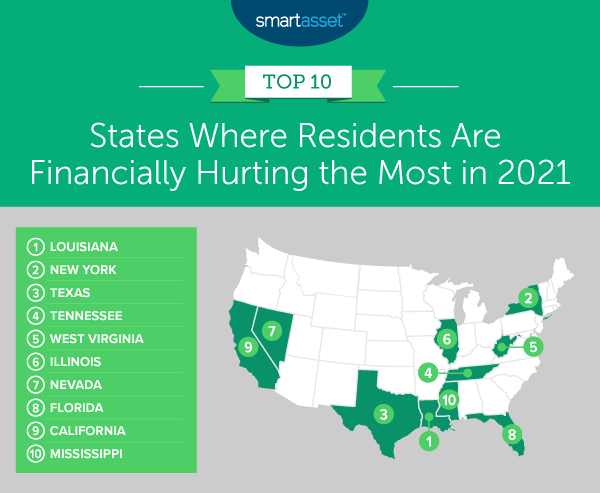
- Six out of the 10 states where residents are most economically vulnerable are Southern. These include Louisiana, Texas, Tennessee, West Virginia, Florida and Mississippi. All six rank in the bottom 20 for their 2019 poverty rate and the bottom 15 for the percentage of residents facing recent housing insecurity. All but West Virginia also rank in the bottom 10 for the percentage of adults experiencing recent food insufficiency.
1. Louisiana
Louisiana ranks in the bottom 20 of the study for all six metrics. At 55%, the state has the lowest unemployment replacement rate – the ratio of average unemployment benefits received to the average worker’s salary. It also has the second-highest 2019 poverty rate (19.0%) and the fifth-highest percentage of adults experiencing recent food insufficiency (13.6%).
2. New York
New York ranks in the bottom third of states for all metrics and in the worst three for four metrics: January 2021 unemployment rate, increase in unemployment during COVID-19, unemployment replacement rate and recent housing insecurity. The New York January 2021 unemployment rate was 8.8% – more than 5% higher than the pre-pandemic rate. We estimate that the unemployment replacement rate is second lowest in our study, at 60%. And finally, 12.3% of residents reported in mid- to late-February 2021 that they either missed last month’s rent or mortgage payment or were not confident that they could make next month’s payment on time.
3. Texas
Texas has the second-highest recent food insufficiency figure in the study, with 15.2% of adults not having enough food over the course of the previous seven days. The state has the 11th-highest 2019 poverty rate (with 13.6% of people experiencing poverty that year) and the 12th-highest change in unemployment during COVID-19 (3.3% from February 2020 to January 2021). Almost 10% of residents reported in mid- to late-February 2021 that they either missed last month’s rent or mortgage payment or were not confident that they could make next month’s payment on time.
4. Tennessee
Though the January 2021 unemployment rate in Tennessee was lower than the national average – at 5.1% – many residents are reporting recent economic distress. Specifically, Tennessee has the fourth-highest and eighth-highest percentage of adults experiencing housing and food insecurity – 11.9% and 12.6%, respectively. The state also has the ninth-highest 2019 poverty rate, at 13.9%.
5. West Virginia
At 16.0%, West Virginia has the sixth-highest 2019 poverty rate across all 50 states. Furthermore, it has the 10th-lowest unemployment replacement rate (73%) and the 11th-highest percentage of adults reporting recent housing insecurity (10.1%).
6. Illinois
Illinois ranks in the bottom 10 of the study for three out of six metrics: January 2021 unemployment rate (ninth-highest in the study, at 7.7%), increase in unemployment during COVID-19 (seventh-highest in the study, at 4.3%) and unemployment replacement rate (sixth-lowest in the study, at 72%).
7. Nevada
Nevada ranks within the bottom half of the study for all metrics. It has the fifth-worst January 2021 employment rate and increase in unemployment during COVID-19, at 8.1% and 4.5%, respectively. Recent Census survey data indicates that 11.8% of adults did not have enough food over the course of the previous seven days – the 11th-highest rate of food scarcity in our study.
8. Florida
Florida has the eighth-highest percentage of residents experiencing recent housing insecurity and fourth-highest percentage of adults experiencing recent food insecurity overall, at 11.0% and 13.7%, respectively. While its January 2021 unemployment rate was the lowest across the 10 states we list here, the figure still totaled 4.8%. In 2019, 12.7% of Florida residents fell below the federal poverty level.
9. California
California ranks in the bottom four states of the study for three metrics: January 2021 employment rate (9.0%), increase in unemployment during COVID-19 (5.1%) and unemployment replacement rate (67%). The percentage of residents experiencing recent housing insecurity in the state was 7.9% and the 2019 poverty rate was 11.8%.
10. Mississippi
Mississippi has the highest 2019 poverty rate in the study, at 19.6%. The state also has the second-highest figure for recent housing insecurity, with 13.9% of adults reporting they either missed last month’s rent or mortgage payment or were not confident that they could make next month’s payment on time. Mississippi has the seventh-highest recent food scarcity figure in the study (12.8%) and the 18th-highest January 2021 unemployment rate, at 6.4%.
Data and Methodology
To find the states where residents are financially hurting the most, SmartAsset looked at data for all 50 U.S. states. We compared them across six metrics:
- January 2021 unemployment rate. Data comes from the Bureau of Labor Statistics’ Local Area Unemployment Statistics.
- Change in unemployment during COVID-19. This is the percentage point difference between the February 2020 unemployment rate and January 2021 unemployment rate. Data comes from the Bureau of Labor Statistics’ Local Area Unemployment Statistics.
- Unemployment replacement rate. This is the ratio of average unemployment benefit received to the average worker’s weekly salary. The average unemployment benefit is the benefit under the Pandemic Unemployment Assistance (PUA) Program as part of the CARES Act and includes the $300 weekly bonus from the Biden stimulus plan. Data comes from the U.S. Department of Labor.
- Percentage of adults experiencing recent housing insecurity. This is the percentage of adults who missed last month’s rent or mortgage payment, or who have slight or no confidence that their household can pay next month’s rent or mortgage on time. Data comes from the Census Bureau’s Household Pulse Survey. Respondents were surveyed from Feb. 17 through Mar. 1, 2021.
- Percentage of adults experiencing recent food insufficiency. This is the percentage of adults in households where there was either sometimes or often not enough to eat in the last seven days. Data comes from the Census Bureau’s Household Pulse Survey. Respondents were surveyed from Feb. 17 through Mar. 1, 2021.
- Poverty rate. This is the percentage of residents living below the poverty line. Data comes from the U.S. Census Bureau’s 2019 1-year American Community Survey.
We ranked each state in every metric, giving a half weight to the first two metrics: January 2021 unemployment rate and change in unemployment during COVID-19. We gave a full weight to all other metrics. Using those rankings, we found each state’s average ranking and used the average to determine a final score. The state with the highest average ranking received a score of 100. The state with the lowest average ranking received a score of 0.
Savings Tips During a Financial Downturn
- If possible, keep your budget top of mind. One of the best ways to save more, and bolster your emergency savings if you can, is through budgeting. Our budget calculator can help with this. Beyond looking at how much you spend each month and what six months of expenses would look like, you can see how cutting back on discretionary expenses can increase your savings rate.
- Find someone to help shoulder the burden. A financial advisor can help you make smarter financial decisions to be in better control of your money and navigate the current market. Finding a financial advisor doesn’t have to be hard. SmartAsset’s free tool matches you with financial advisors in five minutes. If you’re ready to be matched with advisors, get started now.
Questions about our study? Contact press@smartasset.com.
Photo credit: ©iStock.com/