 Written by
On June 24, 2021, President Joe Biden reached an agreement with a group of bipartisan Senators for an infrastructure plan that will invest over $1.2 trillion in eight years on roads, water, electricity, broadband internet and other projects. Aimed at revitalizing the American economy, the bill, if passed, would be the largest long-term investment in infrastructure in nearly a century. Keeping this in mind, SmartAsset identified and ranked the states with the best infrastructure in 2021.
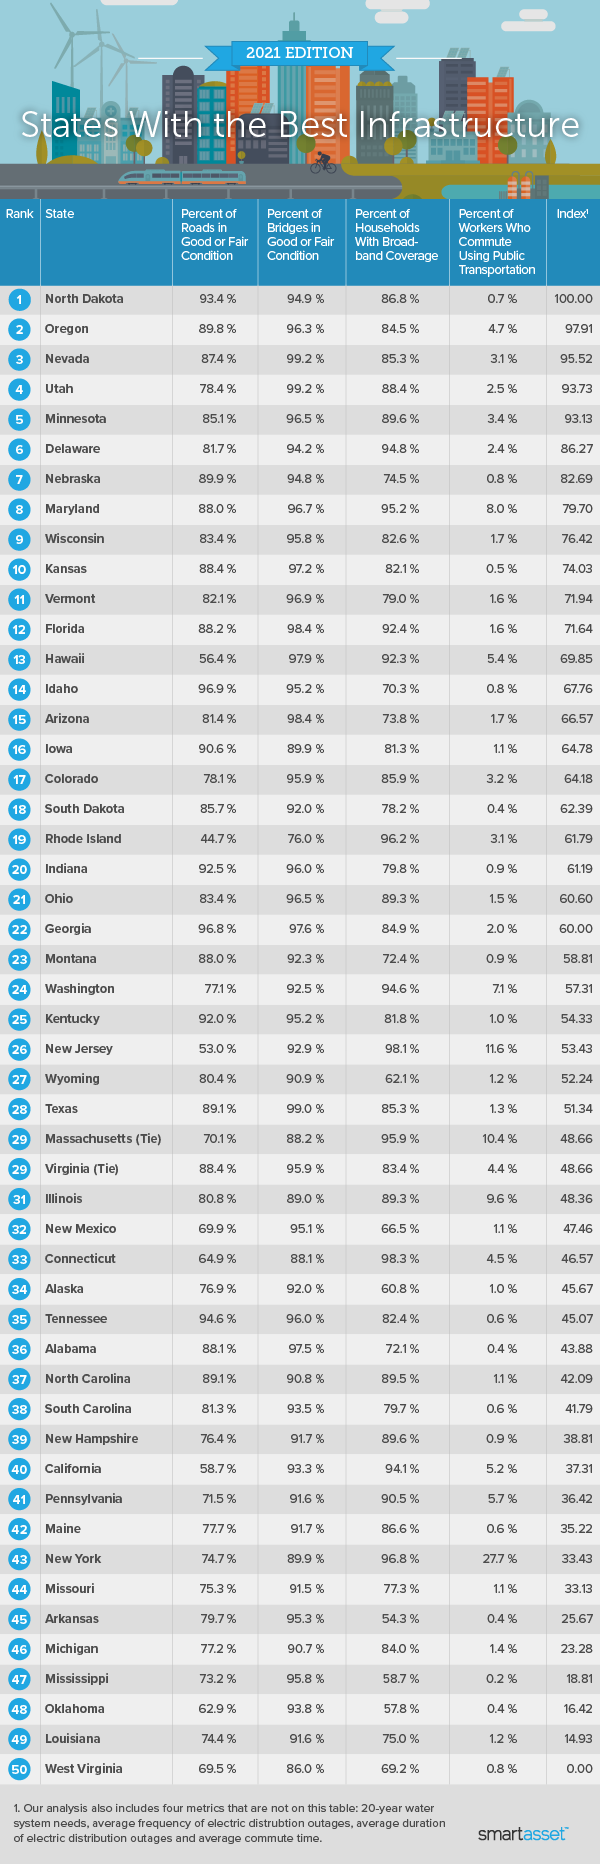
In this study, we looked at the current state of infrastructure in all 50 states to see how different states stack up. We compared states across eight metrics encompassing road, bridge and public transportation quality, internet coverage, water system needs and electric grid reliability. For details on our data sources and how we put all the information together to create our final rankings, check out the Data and Methodology section below.
This is our second study on the states with the best infrastructure. Check out our 2019 edition here.
Key Findings
- Midwestern states take the lead. Five of the top 10 states with the best infrastructure are North Dakota, Minnesota, Nebraska, Wisconsin and Kansas. In all five states, more than 94% of bridges and 83% of roads are in good or fair condition. Additionally, power outage occurrences are relatively uncommon in all five states.
- The average duration of electricity outages varies widely across states. According to 2019 data from the Energy Information Administration (EIA), electricity outages in Arizona last only about 53 minutes, on average. In contrast, the average electricity outage in West Virginia lasts more than seven hours.
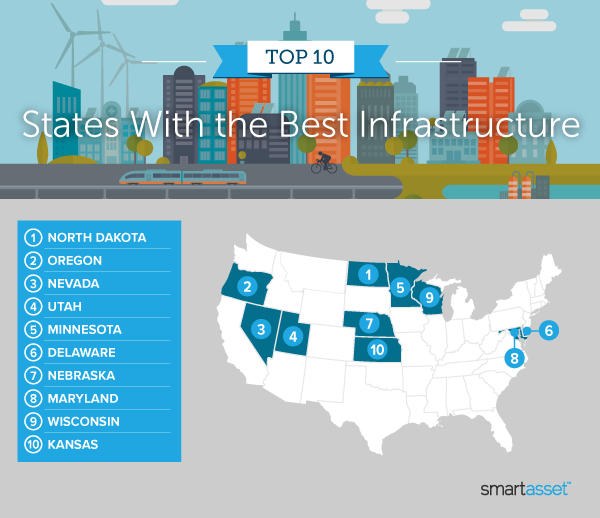
1. North Dakota
North Dakota ranks in the top 10 states for half of the metrics we considered. It has the fourth-highest percentage of roads in good or fair condition (93.4%) and the third-lowest 20-year water system needs (about $715 million). Additionally, the average duration of electric distribution outages is the eighth-lowest (about 77 minutes), and most commuters do not have to travel far to work. The average commute time in North Dakota is roughly 18 minutes – the lowest across all 50 states.
2. Oregon
According to Department of Transportation data, Oregon has the ninth-highest percentage of roads in good or fair condition (89.8%) and the 14th-highest percentage of bridges in good or fair condition (96.3%). Oregon also ranks in the top 20 states for four other metrics. It has the 16th-lowest average commute time (about 24 minutes) and the 10th-highest percentage of workers using public transportation to get to work (4.7%). It also has the fourth-lowest average frequency of power outages and the 16th-lowest average duration of power outages, according to 2019 EIA data.
3. Nevada
Across the eight metrics in our study, Nevada ranks particularly well for its high percentage of bridges in good or fair condition (99.2%). Nevada ranks in the top 20 states for five other metrics: percentage of roads in good or fair condition (87.4%), 20-year water system needs (about $5.3 billion), percentage of commuters who use public transportation (3.1%), average frequency of electricity outages (0.77 times per year) and average duration of electricity outages (less than 78 minutes).
4. Utah
Home to the Hite Crossing Bridge (an arch bridge that crosses the Colorado River), Utah has the highest percentages of bridges in good or fair conditions (99.2%) across all 50 states. Utah ranks in the top 20 states for five additional metrics. It has the 11th-lowest average commute time (22.5 minutes), the 18th-highest broadband coverage (88.4%) and the 15th-lowest average frequency of electricity outages (0.88 times per year). It ranks 17th for both its percentage of commuters who use public transportation (2.5%) and 20-year water system needs (about $4.4 billion).
5. Minnesota
The relatively high percentage of workers commuting using public transportation in Minnesota suggests a strong state infrastructure. Census Bureau data shows that 3.4% of workers rely on public transportation when traveling to and from work, the 13th-highest rate for this metric across all 50 states. Minnesota also has the 12th-highest percentage of bridges in good or fair condition (96.5%) and the eighth-lowest average frequency of electricity outages (less than one per year, on average).
6. Delaware
Delaware ranks as the No. 6 state with the best infrastructure, ranking particularly well for its low 20-year water system needs and widespread broadband coverage. According to an Environmental Protection Agency 2018 report, Delaware has the fifth-lowest 20-year water system fiscal needs across all 50 states, at about $806 million. Almost 95% of residents also have broadband coverage – the seventh-highest rate in our study.
7. Nebraska
Nebraska ranks in the top two states for both its low average frequency and duration of electricity outages. According to EIA data, the average number of annual power outage occurrences that last longer than five minutes (excluding major events) is 0.55. Additionally, the average duration of such outages is about 59 minutes. Nebraska also has the fourth-lowest average commute time, at less than 20 minutes.
8. Maryland
Maryland ranks in the top 15 states for five of the eight metrics we considered. It has the fifth-highest percentage of workers commuting using public transportation (8.0%) and the sixth-highest broadband coverage (95.2%). Almost 97% of bridges are in good or fair condition, the 11th-highest rate in our study. The average frequency and duration of electricity outages are 0.86 times per year and about 89 minutes, respectively.
9. Wisconsin
Wisconsin ranks in the top 15 states for three metrics. It has the 13th-lowest average commute time (about 23 minutes), the third-lowest average duration of electricity outages (0.71 per year) and the 15th-lowest average duration of electricity outages (about 89 minutes). Wisconsin also ranks 20th for both its percentage of workers using public transportation to get to work (1.7%) and percentage of bridges in good or fair condition (95.8%).
10. Kansas
Kansas rounds out our list of the top 10 states with the best infrastructure, ranking particularly well for its low average commute time (about 20 minutes) and high percentage of bridges in good or fair condition (97.2%). Additionally, Kansas has the 12th-highest percentage of roads in good or fair condition (88.4%).
Data and Methodology
To find the states with the best infrastructure, SmartAsset looked at data for all 50 states. We compared the states across the following eight metrics:
- Percent of roads in good or fair condition. Data comes from the Department of Transportation and is for 2020.
- Percent of bridges in good or fair condition. Data comes from the Department of Transportation and is for 2020.
- 20-year water system needs. This is an estimate of each state’s 20-year water system fiscal needs. Data comes from the Environmental Protection Agency’s 2018 report, “Drinking Water Infrastructure Needs Survey and Assessment.”
- Broadband coverage. This is the percentage of the population with broadband coverage. Data comes from BroadbandNow and is for 2021.
- Average frequency of electricity outages. This is the average number of power outages occurrences lasting longer than five minutes and excluding major events in a year. Data comes from the Energy Information Administration and is for 2019.
- Average duration of electricity outages. This is the average duration in minutes of power outages for occurrences lasting longer than five minutes and excluding major events. Data comes from the Energy Information Administration and is for 2019.
- Average commute time. This is the average amount of time in minutes that residents travel back and forth from work. Data comes from the U.S. Census Bureau’s 2019 1-year American Community Survey.
- Percentage of workers using public transportation to get to work. Data comes from the U.S. Census Bureau’s 2019 1-year American Community Survey.
To create our final score, we first ranked each state in each metric. Then we found each state’s average ranking, giving equal weighting to all metrics except average frequency of electric distribution outages and average duration of electric distribution outages, both of which we gave a half weight. We used this average ranking to create our final score. The state with the best average ranking received a 100. The state with the worst average ranking received a 0.
Tips for Commuters Seeking to Relocate
- Moving to a new state? Make sure you can handle a mortgage there. If you’re thinking about settling into a new or perhaps even a bigger home – perhaps to take advantage of better infrastructure and make commuting more worthwhile – be sure to recognize that a mortgage is a big commitment. Be certain you’ll be able to afford whatever you’ll end up having to pay. Use SmartAsset’s mortgage calculator to see the ideal range in which you should be shopping.
- Seek out trusted personal finance advice. A financial advisor can help you make smarter financial decisions such as moving or being in better control of your money. SmartAsset’s free tool matches you with financial advisors in five minutes. If you’re ready to be matched with advisors that will help you achieve your financial goals, get started now.
Questions about our study? Contact us at press@smartasset.com.
Photo credit: ©iStock.com/Daniel Balakov