 Written by
Biking is an eco-friendly, cheap, fun and healthy way to commute in the city. But not all cities are equally accessible for riders – some cities have designated bike lanes, while others simply lack the infrastructure. Nor are all cities the most affordable for the more savings-savvy cyclist. Keeping this in mind, SmartAsset identified and ranked the most bike-friendly cities in America for 2021.
We compared the 100 largest U.S. cities across seven metrics, including bike score, percentage of bicyclist commuters, bicyclist fatalities, miles of protected bike lanes, income after housing costs, average number of days with precipitation and average number of days with extreme temperatures. For details on our data sources and how we put all the information together to create our final rankings, check out the Data and Methodology section below.
Key Findings
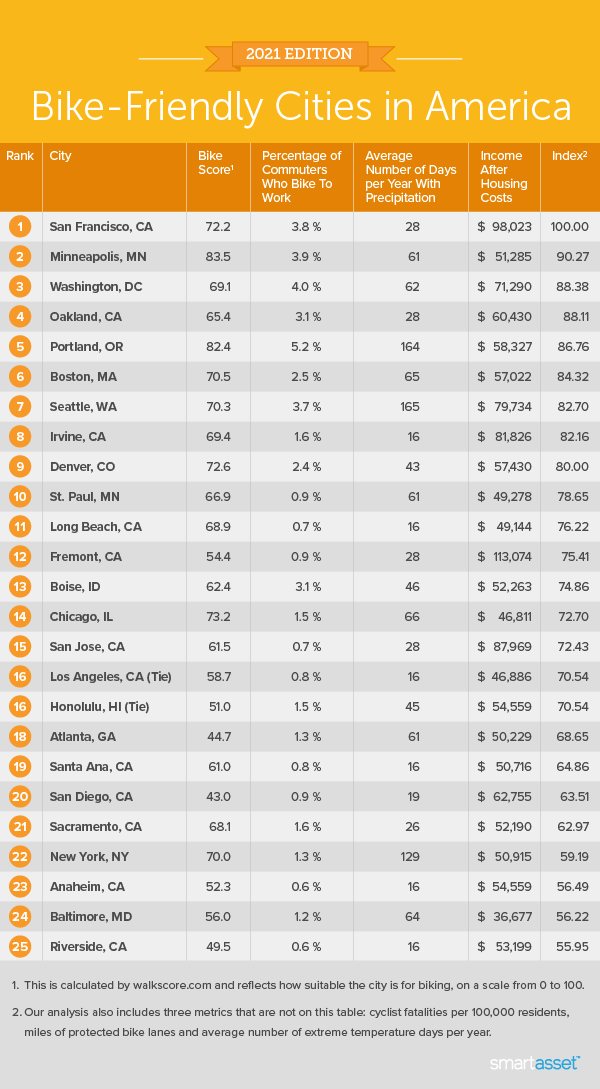
- Western cities are best for cycling. Six out of the top 10 cities in our study are located in the Western part of the U.S. These include San Francisco, California; Oakland, California; Portland, Oregon; Seattle, Washington; Irvine, California; and Denver, Colorado. Though there are some exceptions (it rains a lot in Portland and Seattle!), good scores in weather-related metrics helped these cities rank highest. These cities also rank within the top 15 of the study for percentage of commuters who bike to work and within the top 21 of the study for relatively high income after housing costs.
- More protected bike lanes needed nationwide. While many cities in this study have miles of protected bike lanes, more than half do not, making cyclists vulnerable to oncoming traffic. New York City leads this metric, with more than 124 miles of protected bike lanes. It’s important to note, however, that the city does still rank towards at the middle of the study for its relatively high number of bicyclist fatalities.

1. San Francisco, CA
Temperatures in San Francisco, California almost never dip below 30 degrees or rise above 80 degrees, making the city an ideal climate for frequent cycling. The median household income in the city is the second-highest in the study overall ($98,023). Roughly 3.8% of commuters bike to work, the fifth-highest in the study.
2. Minneapolis, MN
Minneapolis, Minnesota has a bike score of 83.5, the highest in our study. This city ranks third for the percentage of commuters that bike to work (3.9%) and second in miles of protected bike lanes (41.7).
3. Washington, DC
Washington, D.C. has the second-highest percentage of commuters biking to work (4.0%) and ranks ninth-highest in miles of protected bike lanes (11.93). The city, however, falls towards the middle of the study with an average of 1.13 bicyclist fatalities for every 100,000 residents from 2014 through 2018.
4. Oakland, CA
Oakland, California is tied with its neighbor across the Bay, San Francisco, for the lowest number of days with extreme weather (0.17 per year) and has the seventh-highest percentage of commuters biking to work (3.1%). The city averages 27.85 days of precipitation per year, finishing just inside the top quartile.
5. Portland, OR
Around 5.2% of commuters in Portland, Oregon bike to work, the highest percentage in this study for this metric. Portland also has the second-highest bike score overall (82.4). The weather, however, can be more challenging, with an average of more than 163 days of precipitation each year (the fifth-highest overall).
6. Boston, MA
Boston, Massachusetts averages about 19 days per year with extreme temperatures, ranking 25th for this metric across all 100 cities in our study. Bostonians also have the 10th-highest percentage of commuters biking to work (2.5%) and the sixth-highest bike score (70.5) in the study.
7. Seattle, WA
Seattle, Washington averages 165.4 days each year with some precipitation, the third-highest in the study. The city ranks eighth-best, however, for protected bike lanes, with a total of 12.19 miles of them. Many people in Seattle could potentially afford quality rain gear for cycling, though, as the average income after housing is $79,734, the sixth-highest overall.
8. Irvine, CA
Irvine, California has the fifth-highest average income after housing costs ($81,826) in our study. The city also has good weather for cyclists, with only 15.9 days with precipitation on average and less than one day per year of extreme weather (ranking seventh- and sixth-best respectively). The city falls to the bottom quartile, however, for bicyclist fatalities, with an average of 2.02 per every 100,000 residents from 2014 through 2018.
9. Denver, CO
Denver, Colorado has a bike score of 72.6, the fourth-highest in the study. The city also places 11th for two different metrics: percentage of bicyclist commuters (2.4%) and miles of protected bike lanes (9.00). Safety is a concern, though, as Denver finishes in the bottom quartile when it comes to bicyclist fatalities, with an average of 2.20 fatalities for every 100,000 residents from 2014 through 2018.
10. St. Paul, MN
From 2014 through 2018, there were just 0.36 bicyclist fatalities per 100,000 residents on average in St. Paul, Minnesota, the seventh-lowest across all 100 cities we studied. The city has the 15th-highest bike score (66.9) and ranks 10th-best for protected bike lanes (9.40 miles).
Data and Methodology
SmartAsset analyzed 100 of the largest U.S. cities across the following seven metrics to find the best biking cities in America:
- Bike score. This is a measure of how suitable a city is for biking on a scale of 0 to 100. Data comes from walkscore.com and was pulled in May 2021.
- Percentage of commuters who bike to work. Data comes from the Census Bureau’s 2019 1-year American Community Survey.
- Bicyclist fatalities per 100,000 residents. Data comes from the National Highway Traffic Safety Administration (NHTSA) Motor Vehicle Crash Data Querying and Reporting and is for the five-year period from 2014 through 2018. This figure is measured at the county level.
- Miles of protected bike lanes. Data comes from PeopleForBikes.org
- Income after housing costs. This is the median household income minus median annual housing costs. Data comes from the Census Bureau’s 2019 1-Year American Community Survey.
- Average number of days with precipitation. Data comes from the National Oceanic and Atmospheric Association and represents 20-year averages from 2000-2020.
- Average number of days with extreme temperatures. This is the average number of days in one year with temperatures colder than 30 degrees Fahrenheit and warmer than 80 degrees Fahrenheit. Data comes from the National Oceanic and Atmospheric Association and represents 20-year averages from 2000-2020.
First, we ranked each city in each metric. We then found the average ranking for each city, with all but two metrics receiving an equal weight. Bike score and five-year bicyclist fatalities per 100,000 residents each received a double weight. We then used this average ranking to create our final score. The city with the best average ranking received a score of 100 and the city with the worst average ranking received a score of 0.
Tips for Riding into Financial Security
- Fast-track your financial health with professional guidance. No matter whether you bike, walk or drive, a financial advisor can help you create a plan for all of your financial needs. SmartAsset’s free tool matches you with financial advisors in five minutes. If you’re ready to be matched with financial advisors, get started now.
- Need a new ride? Budgeting first is key. If you want to save money for a new bike, SmartAsset’s budget tool can help you figure out how much money you will need to set aside each month to reach your goals.
- It’s never too early to start saving. Even if bicycling isn’t part of your lifestyle now, you might be able to make it part of your everyday routine, both in the immediate future and continuing into retirement. Beginning your savings journey now can help you go the extra mile later.
Questions about our study? Contact press@smartasset.com.
Photo credit: ©iStock.com/Halfpoint