 Written by
About 7.31 million Americans were employed in science, technology, engineering and math (STEM) occupations in 2018, an increase of 7.48% from 2014, when there were 6.80 million STEM workers. Those who are interested in joining this growing industry may have further opportunities to find jobs and save enough, as the Bureau of Labor Statistics (BLS) expects an uptick in most STEM occupations over the next decade. According to BLS predictions, there will be 8.05 million STEM workers in 2028.
Though most STEM jobs have grown over the past years and are expected to continue that upward trend, some specific occupations have gained more ground than others. In this study, we looked at the changing landscape of STEM and uncovered the fastest-growing STEM jobs in the U.S. For details on our data sources or how we put the information together to create our findings, check out the Data and Methodology section below.
Key Findings
- Overall growth in the STEM field is slowing. Over the past four years, the number of STEM jobs in the U.S. increased by 7.48%, or an annualized rate of 1.45%. Over the coming 10 years, the BLS expects STEM jobs to increase by 10.13%, or a rate of only 1.01% every year.
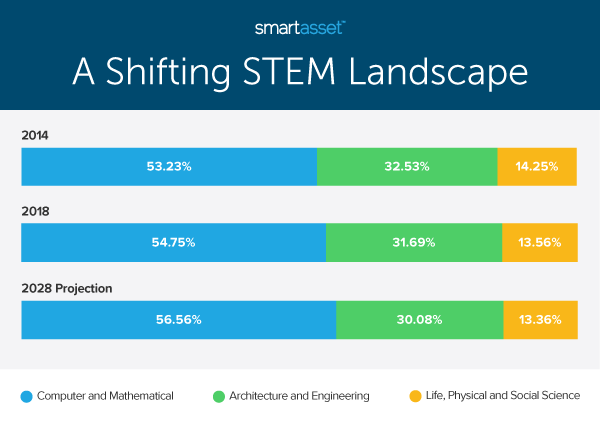
- STEM jobs are shifting toward those with a computer and mathematical focus. In 2014, 53.23% of STEM jobs fell under the category of computer and mathematical occupations. That percentage grew over the four years since and is expected to continue to grow. In 2018, 54.75% of STEM jobs had a computer and mathematical focus, and the BLS predicts that this percentage will increase to 56.56% by 2028.
- Large STEM occupations can expect continued growth. Many of the occupations that rank in our list of the top 25 fastest-growing STEM jobs are already fairly large. In particular, the four largest STEM jobs in 2018 – applications software developers, computer user support specialists, computer systems analysts and systems software developers – all rank in the 10 fastest-growing STEM jobs. In 2018, each of these four occupations employed more than 400,000 workers each.
STEM Categories
The BLS sorts STEM jobs according to three primary categories: computer & mathematical occupations; architecture & engineering occupations and life, physical & social science occupations. Of the total 808 occupations that the BLS details, there are 85 that fall in those three categories. The table below shows the number of occupations in each category as well as the total number of jobs in each category in 2014 and 2018, along with the predicted number for 2028.
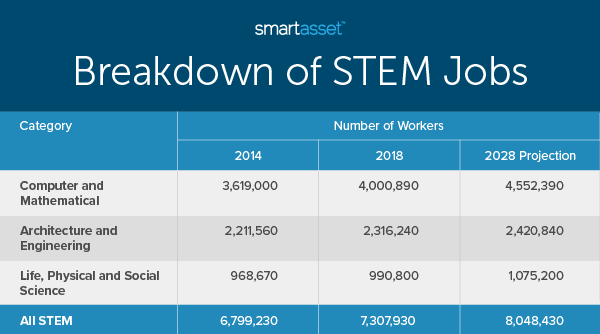
Despite comprising just 16 of the 85 STEM occupations, the computer & mathematical occupations category employs more workers than the categories of architecture & engineering occupations and life, physical & social science occupations combined. In 2018, about 4 million Americans were employed in computer & mathematical occupations. By contrast, there were about 2.32 million architecture & engineering workers and fewer than 1 million life, physical & social science workers. The number of computer & mathematical jobs has increased by 10.55% over the past four years and is expected to increase by 13.78% between 2018 and 2028.
While there are more architecture & engineering and life, physical & social science workers today than there were four years ago, increases for those two categories have been smaller. Between 2014 and 2018, the number of architecture & engineering jobs and life, physical & social science jobs increased by 4.73% and 2.28%, respectively. The BLS estimates that by 2028 there will be about 105,000 more architects & engineers and 84,000 more life, physical & social science workers, marking predicted 10-year increases of 4.52% and 8.52%, respectively.
The graph below shows the distribution of STEM jobs across the three categories in 2014 and 2018 along with the predicted distribution for the year 2028.
Computer and Mathematical Occupations
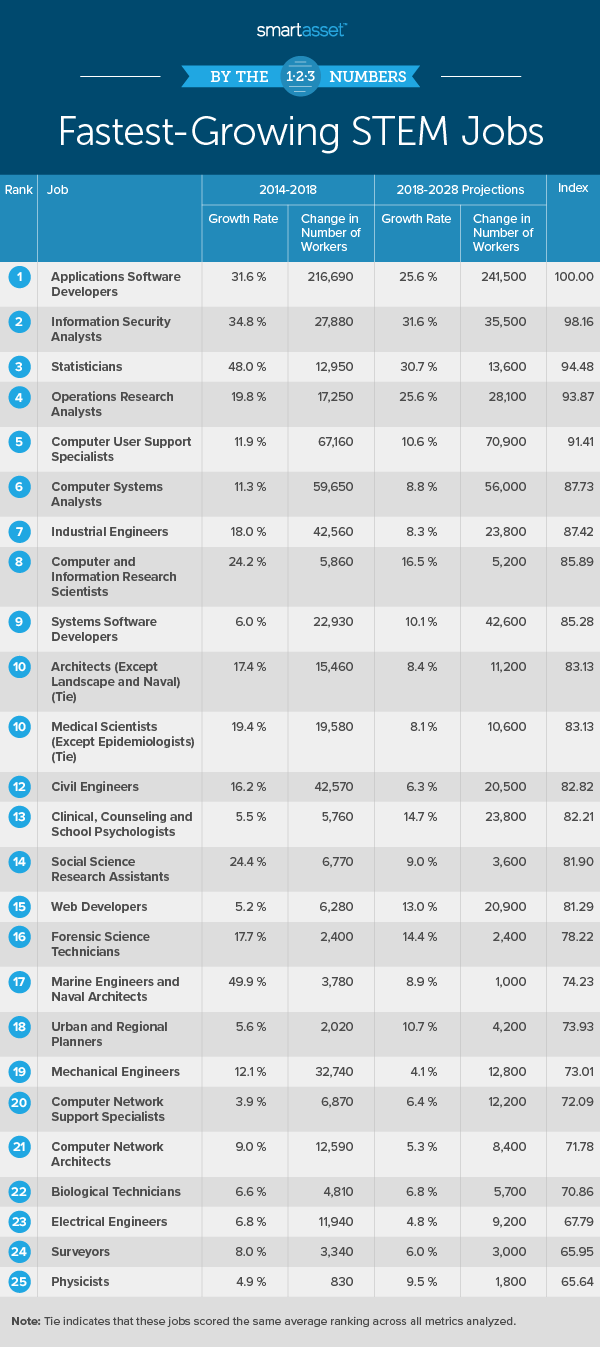
Of the 16 computer & mathematical occupations, 11 make it into our list of the top 25 fastest-growing STEM jobs and seven make it into the top eight, with application software developers taking the top spot. Applications software developers was the largest STEM occupation in 2018, employing 903,160 workers, and it is expected to grow by more than 25% over the next 10 years. The remaining six computer & mathematical occupations in the top 10% of our study include information security analysts, statisticians, operations research analysts, computer user support specialists, computer systems analysts and computer & information research scientists.
Information security analysts and statisticians rank as the No. 2 and No. 3 fastest-growing STEM occupations, respectively. Both occupations grew at a faster percentage rate than applications software developers between 2014 and 2018, but since they employ fewer workers, smaller numbers of workers joined the occupations over that time. Both occupations are additionally expected to grow by more than 30% in the next 10 years, which translates to additions of 35,500 information security analysts and 13,600 statisticians to the workforce.
Of the remaining eight computer & mathematical occupations in our top 25, we observed the following trends: Computer & information research scientists had the largest percentage growth from 2014 to 2018 (24.20%) while computer user support specialists grew by the largest number of workers during those years (67,160). Looking forward to 2028, operations research analysts are expected to grow at the highest rate over the coming years (25.60%), while the occupation of computer user support specialists is expected to have the highest addition of workers between 2018 and 2028 (almost 71,000).
Architecture and Engineering Occupations
Seven of the total 32 architecture & engineering occupations rank in the top 25 fastest-growing STEM occupations. They include industrial engineers, architects (except landscape and naval), civil engineers, marine engineers & naval architects, mechanical engineers, electrical engineers and surveyors.
Industrial engineer ranks seventh overall while architect (except landscape and naval) ties for 10th place. Over the past four years, the number of industrial engineers grew by about 18%, or the 12th-highest increase in percentage terms, and by a total of 42,560, or the fifth-highest increase in gross terms. The BLS predicts that the occupation will continue to grow over the coming years, though at a slower pace. According to their projections, the number of industrial engineers will increase by 8.30%. The projected 10-year growth is slightly higher for architects (except landscape and naval), at 8.40%.
Of the remaining four fastest-growing architecture and engineering occupations, marine engineers & naval architects had the largest percentage growth over the past four years while the occupation of civil engineers grew the most by number of workers. Between 2014 and 2018, the occupation of marine engineers & naval architects grew by almost 50%, the highest percentage growth in our study. Meanwhile, with an addition of almost 43,000 workers over the same time period, there were a total of roughly 306,000 civil engineers in the workforce in 2018.
Life, Physical and Social Science Occupations
There are also seven life, physical & social science occupations that rank in our top 25. They include medical scientists (except epidemiologists); clinical, counseling & school psychologists; social science research assistants; forensic science technicians; urban & regional planners; biological technicians and physicists. On average, those occupations grew by about 12% between 2014 and 2018 and are expected to grow by more than 10% between 2018 and 2028.
The occupation of medical scientists (not including epidemiologists) ranks the highest among life, physical and social science occupations, tying for 10th with architects (not including landscape and naval). Though the number of medical scientists in this occupation classification grew by almost 20,000 (more than 19%) between 2014 through 2018, the growth rate is expected to slow into 2028, following the trend across many STEM jobs. The BLS predicts that the occupation will grow by only about 8% over the coming 10 years, well behind many other computer & mathematical occupations.
Data and Methodology
The Bureau of Labor Statistics (BLS) defines science, technology, engineering and math (STEM) occupations as including computer & mathematical, architecture & engineering, and life & physical science occupations, as well as managerial and postsecondary teaching occupations related to those functional areas and sales occupations requiring scientific or technical knowledge at the postsecondary level. For the purpose of this report, we considered only occupations falling under the first three categories. Of the total 808 BLS defined occupations, 85 are part of those three categories.
To find which STEM jobs are growing the fastest, we compared those occupations across the following four metrics:
- Four-year percentage growth. Data comes from the Bureau of Labor Statistics and is for 2014 through 2018.
- Four-year growth in number of workers. Data comes from the Bureau of Labor Statistics and is for 2014 through 2018.
- 10-year expected percentage growth. Data comes from the Bureau of Labor Statistics and is for 2018 through 2028.
- 10-year expected growth in number of workers. Data comes from the Bureau of Labor Statistics and is for 2018 through 2028.
Using the four metrics above, we ranked each occupation in every metric, giving each metric an equal weight. We then found each occupation’s average ranking and used that average to determine a final score. The occupation with the highest average ranking received a score of 100. The occupation with the lowest average ranking received a score of 0.
Savings Tips for STEM Workers
- Invest early. With relatively high income and earnings, many STEM workers may be able to have an early retirement. To do this, it is important to take advantage of compound interest by investing early. Take a look at our investment calculator to see how your investment in a savings account can grow over time.
- Contribute to a 401(k) or IRA. One of the best ways to save is through a retirement savings account. A 401(k) is an employer-sponsored defined contribution plan in which you divert pre-tax portions of your monthly paycheck into a retirement account. Some employers will also match your 401(k) contributions up to a certain percentage of your salary, meaning that if you chose not to contribute, you are essentially leaving money on the table. Our 401(k) calculator can help you determine what you saved for retirement so far and how much more you may need. If your employer does not offer a 401(k) plan, an IRA is another great option.
- Consider professional help. A financial advisor can help you make smarter financial decisions to be in better control of your money. Finding the right financial advisor who fits your needs doesn’t have to be hard. SmartAsset’s free tool matches you with financial advisors in your area in five minutes. If you’re ready to be matched with local advisors that will help you achieve your financial goals, get started now.
Questions about our study? Contact us at press@smartasset.com
Photo credit: ©iStock.com/FG Trade