 Written by
The days of the strict 40-hour workweek, with weekends and evenings spent relaxing, are a distant memory for many people. According to Bureau of Labor Statistics (BLS) data from 2019, more than 10 million Americans work at least 60 hours per week. And for those lucky enough to have a job amid the COVID-19 pandemic, shelter-in-place rules have kept many working from home, a fact that has reduced the separation between the office and home-life. In fact, recent data from NordVPN shows Americans are working three hours more per day during coronavirus lockdowns than before. Though the constant connectivity and persistent Zoom meetings may exacerbate exhaustion as workers grind to build up their savings, there are a whole host of factors that are fatiguing the workforce. With all that in mind, SmartAsset crunched the numbers to find the cities where worker burnout is most likely.
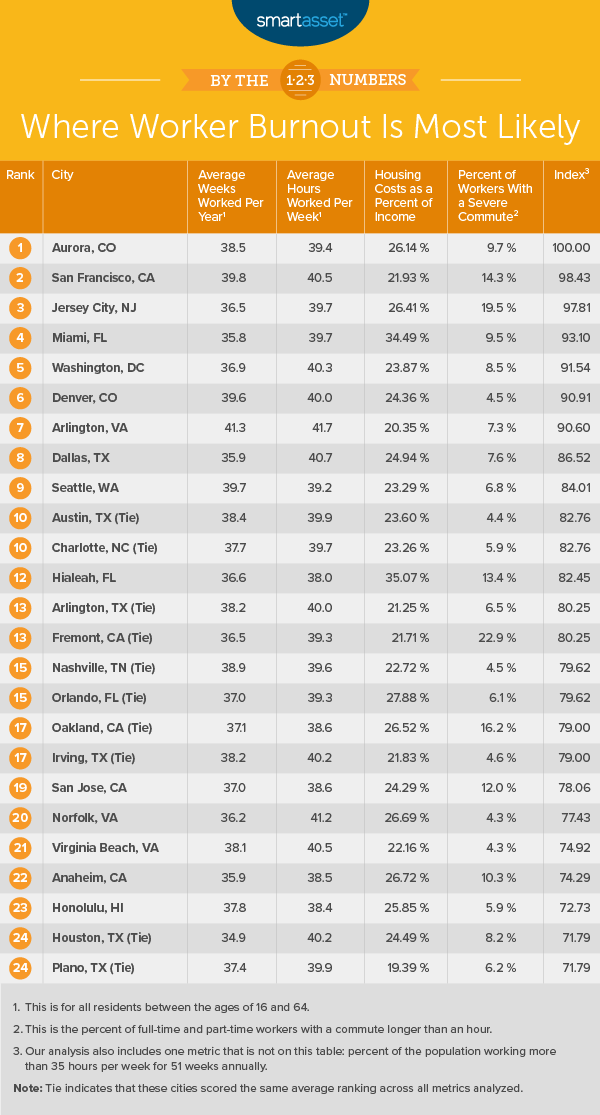
Specifically, we considered data for the 100 most-populous U.S. cities across the following five metrics: average number of weeks worked per year, average number of hours worked per week, percentage of population working more than 1,700 hours in a year (the equivalent of 35 hours per week for 51 weeks), percentage of workers with a commute longer than an hour and housing costs as a percentage of income. For details on our data sources and how we put all the information together to create our final rankings, check out the Data and Methodology section below.
Key Findings
- Worker burnout is less likely in the Midwest. None of the top 11 cities in our study are located in the Midwest. In fact, the first Midwestern city to rank in the study is Chicago, Illinois, appearing at No. 28.
- Long hours across the top 11. An average of 58.2% of workers in our top 11 cities work more than 1,700 hours a year, compared to just 52.2% across all cities. For that metric, all cities in our top 11 rank in the top 20, except for Dallas, Texas at 21.
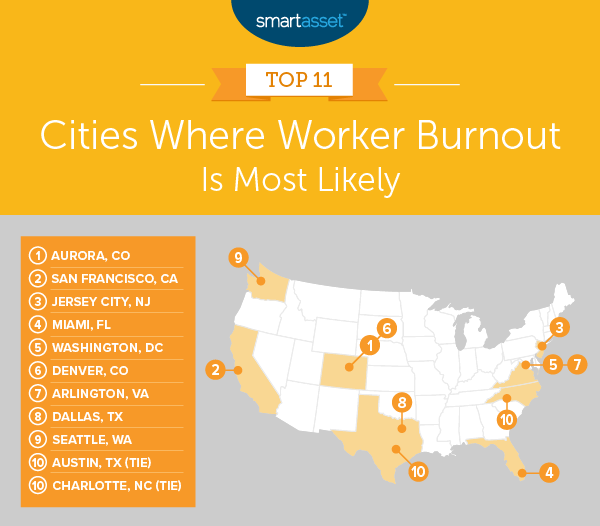
1. Aurora, CO
Aurora, Colorado, a suburb of Denver, is the city most prone to worker burnout. Residents there work an average of 38.5 weeks each year, the eighth-highest amount for this metric in our study. Aurora also ranks in the bottom 20% for two other metrics: its high percentage of workers averaging at least 35 hours a week over 51 weeks – at 58% – and high percentage of workers with a commute of longer than an hour, at 9.7%.
2. San Francisco, CA
San Francisco, California workers are on the clock for an average of 39.8 weeks per year, the second-highest rate for this metric in the study. They also work an average of 40.5 hours per week, the seventh-highest rate for this metric in the study. Around 59% of workers average more than 1,700 hours a year, the fifth-highest rate across all 100 cities we studied. Additionally, San Francisco ranks 11th-worst overall for its relatively high percentage of workers with a severe commute (a commute longer than one hour), at 14.3%.
3. Jersey City, NJ
Right across the Hudson from New York City, Jersey City ranks in the worse half of the study for all metrics we considered. It has the fourth-highest percentage in the study of workers who commute for more than an hour, at 19.5%. It also has the 19th-highest rate for average number hours worked per week, at 39.7. Around 56.7% of workers in Jersey City are on the job at least 1,700 hours per year, the 17th-highest rate for this metric across all 100 cities we examined.
4. Miami, FL
Miami, Florida workers might be relatively stressed out by their expenses, as housing costs represent 34.49% of income, the third-highest percentage in the study for this metric. Miami ties with Jersey City for the 19th-longest workweek, which is an average of 39.7 hours. Furthermore, it ranks 21st of 100 for its relatively high percentage of workers with a commute of at least one hour, at 9.5%.
5. Washington, DC
Washington, D.C. has the ninth-highest number of average hours worked per week in this study, at 40.3 hours. The city ranks 11th for its high percentage of residents work at least 1,700 hours per year, at 58.20%. Workers in the nation’s capital spend an average of 36.9 weeks per year on the job, the 33rd-highest across all the cities we examined.
6. Denver, CO
Denver, Colorado workers put in 39.6 weeks per year on the job, the fourth-highest rate for this metric in the study. Denver also had the third-highest percentage overall of workers who logged at least 1,700 hours per year, at 59.5%. Employees there are at the office or on the jobsite for an average of 40 hours per week, the 14th-highest rate for this metric across all 100 cities we analyzed.
7. Arlington, VA
Arlington, Virginia, a suburb of Washington, D.C., has the highest rate in the study for the following three metrics: average number of weeks worked per year, at 41.3; average number of hours worked per week, at 41.7 and percentage of residents working more than 1,700 hours in a year, at 62%. It may not be as stressful to live in Arlington when it comes to homeownership expenses, though, as housing costs are only about 20% of income, the 9th-lowest figure for this metric.
8. Dallas, TX
Dallas, Texas workers log an average of 40.7 hours per week on the job, the third-highest total of the cities we studied. The city ranks toward the middle of the study for its average number of weeks worked in a year, at almost 36 weeks. Around 56.3% of workers in Dallas work more than 1,700 hours in a year.
9. Seattle, WA
Seattle, Washington has the third-highest rate in the study for its average number of weeks worked per year, at 39.7. The Emerald City also comes in 17th of 100 for its relatively high percentage of workers putting in at least 1,700 hours to work each year, at 56.7%.
10. Austin, TX (tie)
Tied for the No. 10 spot on our list is Austin, Texas. The city has the ninth-highest average number of weeks worked per year, at 38.4, and the eighth-highest percentage of the population working more than 1,700 hours per year, at 58.8%.
10. Charlotte, NC (tie)
The other city tied for No. 10 is most likely is Charlotte, North Carolina. Charlotte ranks 10th out of 100 cities for the high percentage of its population working 1,700 hours per year, at 58.30%. Additionally, workers there average 39.7 hours per week on the job, the 19th-highest rate for this metric in this study.
Data and Methodology
To find the cities where worker burnout is most likely, SmartAsset analyzed the 100 largest U.S. cities across the following metrics:
- Average number of weeks worked per year.
- Average number of hours worked per week.
- Percentage of the population working at least 1,700 hours per year (the equivalent of 35 hours per week for 51 weeks).
- Percentage of workers with a commute longer than one hour.
- Housing costs as a percentage of income.
All data comes from the Census Bureau’s 2018 1-year American Community Survey.
First, we ranked all cities for every metric. Giving them all an equal weight, we found each city’s average ranking. We used this average ranking to create our final score. The city with the highest average ranking (i.e. the city where worker burnout is most likely) received a score of 100 and the city with the lowest average ranking (i.e. the city where worker burnout is least likely) received a score of 0.
Tips for Managing Your Money
- If you lack time from working too much, get hands-on help. Work may be stressful, but a financial advisor can help make your life a little bit easier. SmartAsset’s free tool matches you with financial advisors in your area in five minutes. If you’re ready to be matched with local advisors that will help you achieve your financial goals, get started now.
- Work on your savings. Saving for retirement is sure-fire way to reduce your stress about your financial future. Make sure to start saving as early as you can.
- Don’t burn through your budget. A budget can help cut down on financial stress and make sure you have enough cash to pay for the rest and relaxation that will keep you sane.
Questions about our study? Contact press@smartasset.com
Photo credit: ©iStock.com/martin-dm